

HOT TOPICS LIST
- MACD
- Fibonacci
- RSI
- Gann
- ADXR
- Stochastics
- Volume
- Triangles
- Futures
- Cycles
- Volatility
- ZIGZAG
- MESA
- Retracement
- Aroon
INDICATORS LIST
LIST OF TOPICS
PRINT THIS ARTICLE
by Stella Osoba, CMT
Often times, price charts will show price patterns which are contradictory. What should you do?
Position: N/A
Stella Osoba, CMT
Stella Osoba is a trader and financial writer. She is a frequent contributor to "Technical Analysis of Stocks and Commodities" magazine and "Traders.com Advantage" as well as other financial publications.
PRINT THIS ARTICLE
TECHNICAL ANALYSIS
Contradictory Price Patterns
07/30/20 04:15:27 PMby Stella Osoba, CMT
Often times, price charts will show price patterns which are contradictory. What should you do?
Position: N/A
| Using technical analysis successfully means being prepared for signals which are contradictory, not being thrown by them and interpreting them appropriately. This article will discuss two signals which have recently appeared on the Dow Jones Industrial Average daily price chart (INDU): an Island reversal and a symmetrical triangle. |
|
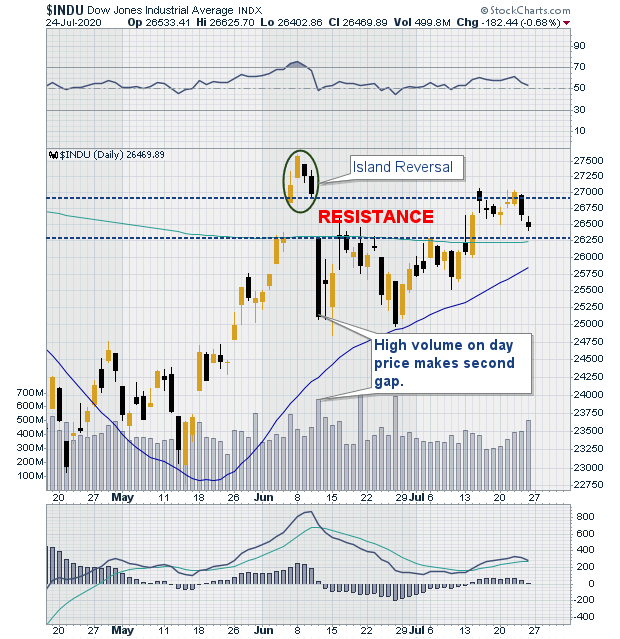
| Figure 1. Island Reversal pattern on DJIA. |
| Graphic provided by: StockCharts.com. |
| |
| An Island Reversal top is as the name suggests, a price reversal pattern. One formed on the INDU daily chart recently, (see Figure 1). In a topping pattern, price is in an uptrend prior to the formation of the pattern. Price then gaps up and forms a top. Price soon reverses and then gaps down out of the pattern. The two gaps on either side of the price pattern must share all or some of the same price. Volume on the day of formation of the second gap is often high. As a reversal pattern, expectation is for an eventual decline in prices, but this is not always the case. The whole of the gap area acts as resistance in this price pattern and until price closes the gap and rises above the high of the island reversal price, the pattern is still in effect. |
|
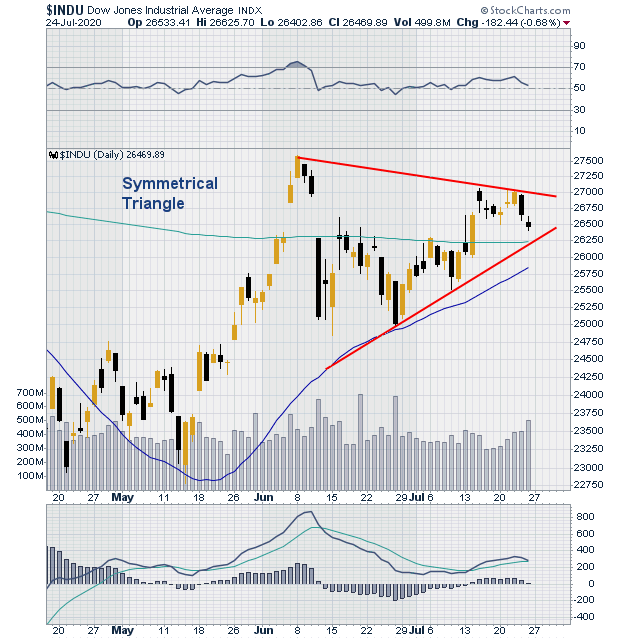
| Figure 2. Symmetrical Triangle on daily chart of DJIA. |
| Graphic provided by: StockCharts.com. |
| |
| The Symmetrical Triangle, or coil, is a continuation price pattern. When price breaks out of the pattern it will usually be in the direction it entered the pattern. Figure Two which is a daily chart of the INDU shows price forming lower highs and higher lows to allow for the drawing of a downward slanting upper trend line and an upper slanting lower trend line. Both lines converge in a classic symmetrical triangle formation. The presence of the symmetrical triangle contradicts the message of the Island Reversal which is not a continuation but a reversal signal. |
| The question to be answered therefore is which signal controls. Is the market hinting at a continuation or a reversal? To take a trade one must always look for confirmation in the direction of the trade. As neither signal has produced confirmation the question is therefore unanswered. |
| Confirmation of the Island Reversal means that either resistance will hold and prices move lower or prices move above the high of the Island reversal and negate the signal. Confirmation of the symmetrical triangle means that price breaks the upper or lower trend line. Throwbacks and pullbacks in both cases are common, so the patience will reveal the markets next direction through confirmatory or negatory price movements. So instead of fretting on what the market will do next, allow it to show you. |
Stella Osoba is a trader and financial writer. She is a frequent contributor to "Technical Analysis of Stocks and Commodities" magazine and "Traders.com Advantage" as well as other financial publications.
| E-mail address: | stellaosoba@gmail.com |
Click here for more information about our publications!
Comments

Request Information From Our Sponsors
- StockCharts.com, Inc.
- Candle Patterns
- Candlestick Charting Explained
- Intermarket Technical Analysis
- John Murphy on Chart Analysis
- John Murphy's Chart Pattern Recognition
- John Murphy's Market Message
- MurphyExplainsMarketAnalysis-Intermarket Analysis
- MurphyExplainsMarketAnalysis-Visual Analysis
- StockCharts.com
- Technical Analysis of the Financial Markets
- The Visual Investor
- VectorVest, Inc.
- Executive Premier Workshop
- One-Day Options Course
- OptionsPro
- Retirement Income Workshop
- Sure-Fire Trading Systems (VectorVest, Inc.)
- Trading as a Business Workshop
- VectorVest 7 EOD
- VectorVest 7 RealTime/IntraDay
- VectorVest AutoTester
- VectorVest Educational Services
- VectorVest OnLine
- VectorVest Options Analyzer
- VectorVest ProGraphics v6.0
- VectorVest ProTrader 7
- VectorVest RealTime Derby Tool
- VectorVest Simulator
- VectorVest Variator
- VectorVest Watchdog