HOT TOPICS LIST
- MACD
- Fibonacci
- RSI
- Gann
- ADXR
- Stochastics
- Volume
- Triangles
- Futures
- Cycles
- Volatility
- ZIGZAG
- MESA
- Retracement
- Aroon
INDICATORS LIST
LIST OF TOPICS
PRINT THIS ARTICLE
by Stella Osoba, CMT
Spotify Technology (SPOT), the digital music streaming service has been one of the wins in this stock market. Its share price has rocketed from a low of $119.18 on March 16, 2020 to a high of $274.30 on July 2, 2020. So what's next for this stock which has been trading as a public company for less than three years?
Position: N/A
Stella Osoba, CMT
Stella Osoba is a trader and financial writer. She is a frequent contributor to "Technical Analysis of Stocks and Commodities" magazine and "Traders.com Advantage" as well as other financial publications.
PRINT THIS ARTICLE
TRITOP/TRI BOTTOM
Spotify's
07/16/20 01:37:50 PMby Stella Osoba, CMT
Spotify Technology (SPOT), the digital music streaming service has been one of the wins in this stock market. Its share price has rocketed from a low of $119.18 on March 16, 2020 to a high of $274.30 on July 2, 2020. So what's next for this stock which has been trading as a public company for less than three years?
Position: N/A
| SPOT debuted on the NYSE on April 3, 2018 in a direct listing (a process by which a company sells shares directly to the public). The reference price was $132. On that day, shares traded as high as $169. The public listing was a success and shares reached a high of $198.99 on July 26, 2018. Afterwards, shares began a steep decline touching a low of $103.29 on December 24, 2018. |
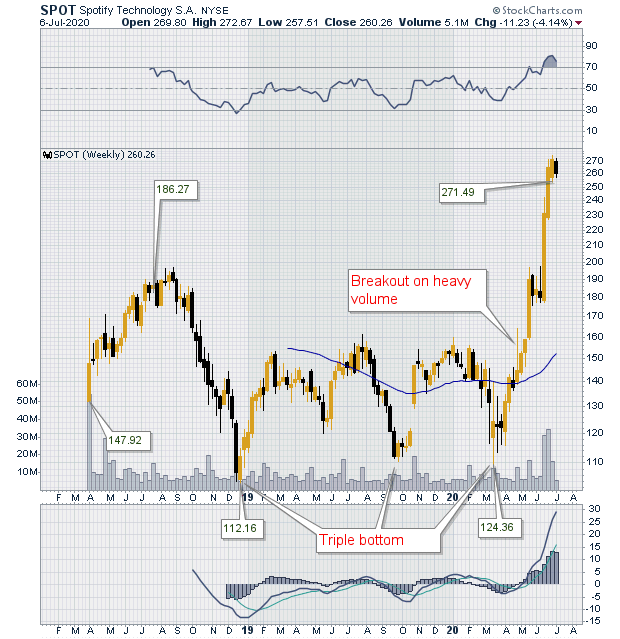
| Shares then traded sideways for the next sixteen months, forming a triple bottom chart pattern (See Figure 1). The fact that the stock saw support at $104 and higher was positive for the stock. Also positive was the amount of time the stock took to form its base. Large bases tend to support stronger trends after the breakout occurs. That happened in this case. The breakout came on April 27, 2020 on twice the volume of the prior week as seen in Figure 1. The long upper tail formed by the weekly candle indicated selling by some of those who had been holding impatiently, possibly waiting for price to allow them to get out near or at breakeven. |

|
| Figure 1. Weekly chart for SPOT. |
| Graphic provided by: StockCharts.com. |
| |
| Stock trading is so often hard because the market controls, we do not. Often people want the market to subjugate its progress to their will. We buy or sell too early and then blame the market or technical analysis for not behaving properly or not working. Cultivating the spirit of patience is one of the most valuable of all skills for a trader. |
| The parabolic move up after the breakout was spectacular. But it can also be a learning opportunity for those who did not see the move or jumped ship too early. Often when one is in a trade, the fluctuations caused by noise are enough to shake us out, but remember stock prices move like waves, there will always be ebbs and flows. It is not necessary to hold mechanically onto a position, but it is essential to not be shaken out either; sell when there is a reason to sell. |

|
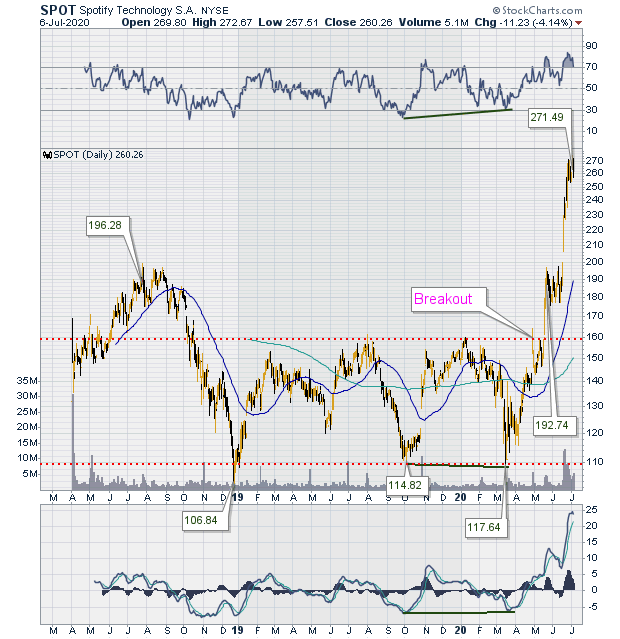
| Figure 2. Daily chart for SPOT. |
| Graphic provided by: StockCharts.com. |
| |
| Figure 2 is the daily chart of SPOT. The fact that price is near the top of the chart on the right-hand side should not fool anyone into thinking that the trend is over. Price may well react or trend sideways but it can always move higher. Allow the market to show you what it will do and then make the trade. |
Stella Osoba is a trader and financial writer. She is a frequent contributor to "Technical Analysis of Stocks and Commodities" magazine and "Traders.com Advantage" as well as other financial publications.
| E-mail address: | stellaosoba@gmail.com |
Click here for more information about our publications!
PRINT THIS ARTICLE

Request Information From Our Sponsors
- StockCharts.com, Inc.
- Candle Patterns
- Candlestick Charting Explained
- Intermarket Technical Analysis
- John Murphy on Chart Analysis
- John Murphy's Chart Pattern Recognition
- John Murphy's Market Message
- MurphyExplainsMarketAnalysis-Intermarket Analysis
- MurphyExplainsMarketAnalysis-Visual Analysis
- StockCharts.com
- Technical Analysis of the Financial Markets
- The Visual Investor
- VectorVest, Inc.
- Executive Premier Workshop
- One-Day Options Course
- OptionsPro
- Retirement Income Workshop
- Sure-Fire Trading Systems (VectorVest, Inc.)
- Trading as a Business Workshop
- VectorVest 7 EOD
- VectorVest 7 RealTime/IntraDay
- VectorVest AutoTester
- VectorVest Educational Services
- VectorVest OnLine
- VectorVest Options Analyzer
- VectorVest ProGraphics v6.0
- VectorVest ProTrader 7
- VectorVest RealTime Derby Tool
- VectorVest Simulator
- VectorVest Variator
- VectorVest Watchdog
