HOT TOPICS LIST
- MACD
- Fibonacci
- RSI
- Gann
- ADXR
- Stochastics
- Volume
- Triangles
- Futures
- Cycles
- Volatility
- ZIGZAG
- MESA
- Retracement
- Aroon
INDICATORS LIST
LIST OF TOPICS
PRINT THIS ARTICLE
by David Penn
When spotting a trend reversal, use all the help you can get.
Position: N/A
David Penn
Technical Writer for Technical Analysis of STOCKS & COMMODITIES magazine, Working-Money.com, and Traders.com Advantage.
PRINT THIS ARTICLE
REVERSAL
Reversals, Price Channels and Candlesticks
01/07/03 08:02:17 AMby David Penn
When spotting a trend reversal, use all the help you can get.
Position: N/A
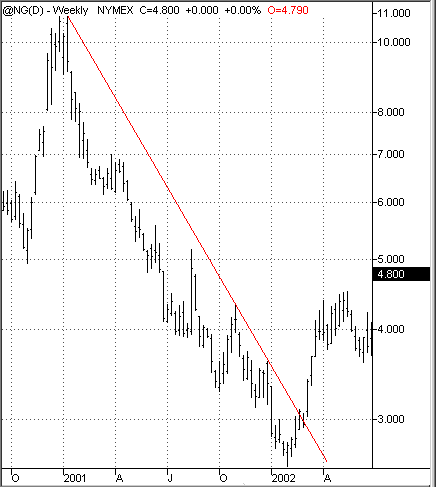
| Who (or what) gained in 2002? Try natural gas prices, which began the year in the final stages of a bear market that had seen natural gas prices correct from their late December 2000 highs by as much as 77%. Save for occasional one-week rallies, natural gas prices moved in almost a straight line down for virtually all of 2001. |

|
| Figure 1: The bear market in natural gas lasted approximately one year and took gas prices down by more than 75%. |
| Graphic provided by: TradeStation. |
| |
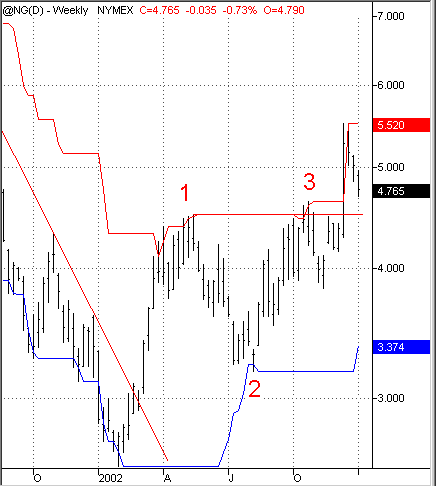
Fortunately, as I assert in an upcoming discussion for Working Money.com (look for "Buy and Hold Bonanzas"), opportunity often arrives in the wake of such dramatic market moves. While the truism that it is dangerous to attempt to catch a falling knife remains valid (after all, that which falls 70% can still fall 85% or 90%), it is equally valid that extended price moves--to the downside or upside--quite often over-reach. Thus, after a bear market in natural gas that has lasted for just over a year, some sort of counter-reaction, a "bounce," is to be expected. The bigger question is whether or not the likely bounce represents a possible change in trend. Figure 2: A 1-2-3 trend reversal appears in this weekly chart of natural gas. The bounce in natural gas came in the first quarter of 2002. As measured by continuous futures, natural gas broke through a year-old down trendline in late February/early March at about 3.00 and continued upward until reaching an intermediate peak of about 4.50 in May. This peak came shortly after natural gas prices had exceeded the high of Q4 2001. A correction then followed, with natural gas moving back down toward the 3.25 area going into the summer months of 2002. This price movement--with the rally breaking a significant down trendline, and a subsequent correction that does not mark new lows--strongly suggested the possibility of a 1-2-3 trend reversal (popularized by Victor Sperandeo and most recently discussed here in my Working Money piece "1-2-3 Trend Reversals"). The "1" in the methodology represents the trendline-breaking rally's peak, and the "2" represents the subsequent correction low. It is worth noting that Sperandeo considers "2" as a potential low-risk entry point--particularly if other technical and fundamental factors are supportive. While I won't get into fundamental factors here, the August low in 2002 appears to have found technical support around 3.15 from the previous lows in December 2001. The 20-day price channel on this chart shows how helpful price channels can be in determining potential support points. Someone watching the correction unfold in the late spring could have kept track of previous support areas along the 20-day price channel to see where natural gas prices might have been able to stem their decline. Based on the price channel from late 2001, 3.28 and 3.11 were levels that might have provided support. As it turns out, support was found more or less in between those two levels. |
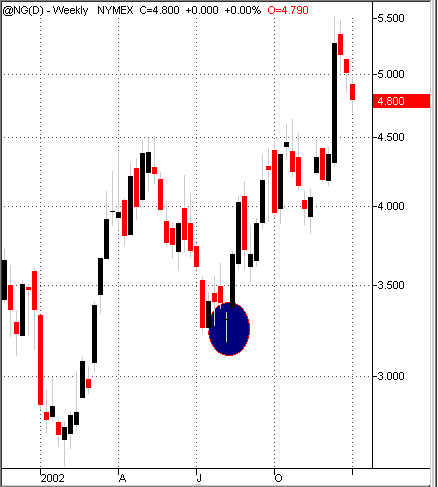
 Figure 3. This doji at the end of natural gas' 12-week decline underscored the likelihood of a bullish reversal. I mention candlesticks in the title of this article. But at the same time, I don't think it is as necessary to use candlesticks as it is to be able to recognize the same patterns in bars that one more easily recognizes in candlesticks. Here, I'm referring to the more common candlesticks, such as piercing and engulfing candlesticks, morning and evening star combinations, as well as shooting stars, dojis and hammers after extended moves. The August weekly low in natural gas' intermediate decline in the spring of 2002, for example, was in the form of a doji. A doji features an open and close that are more or less at the same level and often in the middle or upper end of the intraday range. This intraday range may be expressed by a long shadow above the open and close, a long shadow below the open and close, or shadows both above and below the open/close level. At the end of a significant downtrend (here, natural gas had been in a decline for 12 weeks) a doji with a long lower shadow can signal a bullish reversal--which appears to have been the case here. |
| To date, the rally in natural gas that began at the beginning of 2002 has seen natural gas increase in price from a low of 2.58 in February 2002 to a recent high of 5.52 in mid-December. This 294-point advance has retraced approximately 35% of the losses from the bear market of 2001. But does this rally signify that the bear market in natural gas is over and, more importantly, that a new bull market has begun--or is the rally just of the "bear market" variety? There is an important test coming up as nautral has experienced a short-term (three weeks, so far) correction in late December 2002. This correction has taken natural gas prices from the high at 5.52 down toward a test of resistance-turned-support in the 4.60-4.50 level. Should natural gas prices find support here and resume their advance, then higher natural gas prices--including a possible breach of the high at 5.52--are increasingly likely. |
Technical Writer for Technical Analysis of STOCKS & COMMODITIES magazine, Working-Money.com, and Traders.com Advantage.
| Title: | Technical Writer |
| Company: | Technical Analysis, Inc. |
| Address: | 4757 California Avenue SW |
| Seattle, WA 98116 | |
| Phone # for sales: | 206 938 0570 |
| Fax: | 206 938 1307 |
| Website: | www.Traders.com |
| E-mail address: | DPenn@traders.com |
Traders' Resource Links | |
| Charting the Stock Market: The Wyckoff Method -- Books | |
| Working-Money.com -- Online Trading Services | |
| Traders.com Advantage -- Online Trading Services | |
| Technical Analysis of Stocks & Commodities -- Publications and Newsletters | |
| Working Money, at Working-Money.com -- Publications and Newsletters | |
| Traders.com Advantage -- Publications and Newsletters | |
| Professional Traders Starter Kit -- Software | |
Click here for more information about our publications!
Comments
Date: 01/07/03Rank: 4Comment:
Date: 01/10/03Rank: 5Comment: Thanks so much for taking up my suggestion of writing this article. If it wasn t me more power to you. I have already loaded up on O/G stocks and am looking for good things. I m already up 40% on one of them. If you look at the charts in the various o/g sectors you will see a wide variety of stage 1 breakouts (refer to Weinstein) that are just starting their most active stage 2 phases. Looking for doubles on a few of them.
Date: 01/11/03Rank: 4Comment:
Date: 01/16/03Rank: 3Comment:
Date: 01/21/03Rank: 5Comment:

Request Information From Our Sponsors
- StockCharts.com, Inc.
- Candle Patterns
- Candlestick Charting Explained
- Intermarket Technical Analysis
- John Murphy on Chart Analysis
- John Murphy's Chart Pattern Recognition
- John Murphy's Market Message
- MurphyExplainsMarketAnalysis-Intermarket Analysis
- MurphyExplainsMarketAnalysis-Visual Analysis
- StockCharts.com
- Technical Analysis of the Financial Markets
- The Visual Investor
- VectorVest, Inc.
- Executive Premier Workshop
- One-Day Options Course
- OptionsPro
- Retirement Income Workshop
- Sure-Fire Trading Systems (VectorVest, Inc.)
- Trading as a Business Workshop
- VectorVest 7 EOD
- VectorVest 7 RealTime/IntraDay
- VectorVest AutoTester
- VectorVest Educational Services
- VectorVest OnLine
- VectorVest Options Analyzer
- VectorVest ProGraphics v6.0
- VectorVest ProTrader 7
- VectorVest RealTime Derby Tool
- VectorVest Simulator
- VectorVest Variator
- VectorVest Watchdog
