

HOT TOPICS LIST
- MACD
- Fibonacci
- RSI
- Gann
- ADXR
- Stochastics
- Volume
- Triangles
- Futures
- Cycles
- Volatility
- ZIGZAG
- MESA
- Retracement
- Aroon
INDICATORS LIST
LIST OF TOPICS
PRINT THIS ARTICLE
by Stella Osoba, CMT
In 2015, Kanye West told style.com that he wanted to be "the Steve Jobs of the Gap." In 2020, it was announced that Gap, Inc. (GPS) and Yeezy have struck a 10 year collaboration deal. The news sent shares of GPS soaring on Friday, June 26, 2020.
Position: N/A
Stella Osoba, CMT
Stella Osoba is a trader and financial writer. She is a frequent contributor to "Technical Analysis of Stocks and Commodities" magazine and "Traders.com Advantage" as well as other financial publications.
PRINT THIS ARTICLE
TECHNICAL ANALYSIS
The Steve Jobs Of Gap
07/01/20 05:50:18 PMby Stella Osoba, CMT
In 2015, Kanye West told style.com that he wanted to be "the Steve Jobs of the Gap." In 2020, it was announced that Gap, Inc. (GPS) and Yeezy have struck a 10 year collaboration deal. The news sent shares of GPS soaring on Friday, June 26, 2020.
Position: N/A
| Sometime in the 1990's, West was a GPS employee, working as a sales assistant. Now West is well on his way to achieving the vision he espoused in his 2015 interview with style.com. The question here is this, will the Yeezy/Gap partnership succeed in bringing long term value to this struggling retailer? |
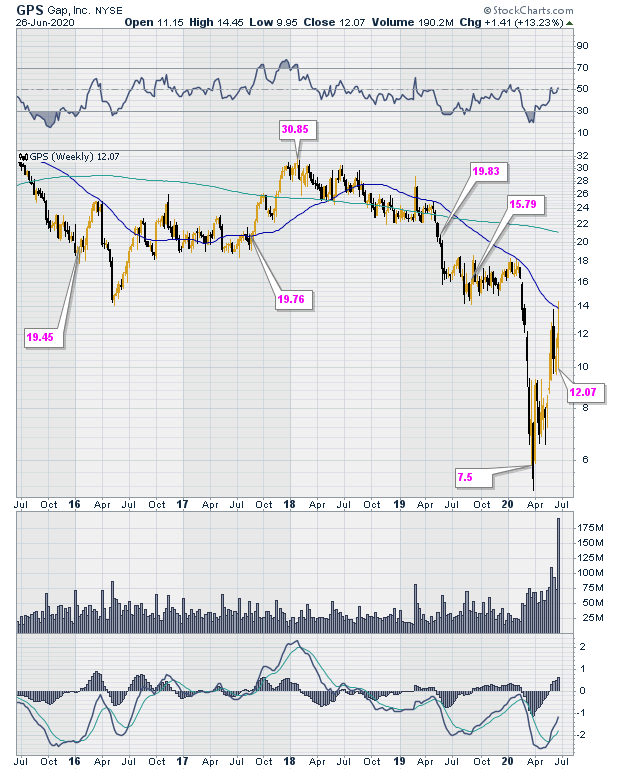
| GPS had been in a sustained downtrend from January 2018 until the end of the first quarter of 2020 (See Figure 1). From a high of around $30.85 reached in January 2018, its shares fell to a low of around $5.00 in March of 2020. However, the stock price was already rising in-line with the general market when the news was announced about the long term collaborative partnership with the Yeezy creator. The first offering of "modern, elevated basics" for men, women and children are set to drop in Gap stores in 2021. |
|
| Figure 1. Weekly chart for GPS. |
| Graphic provided by: StockCharts.com. |
| |
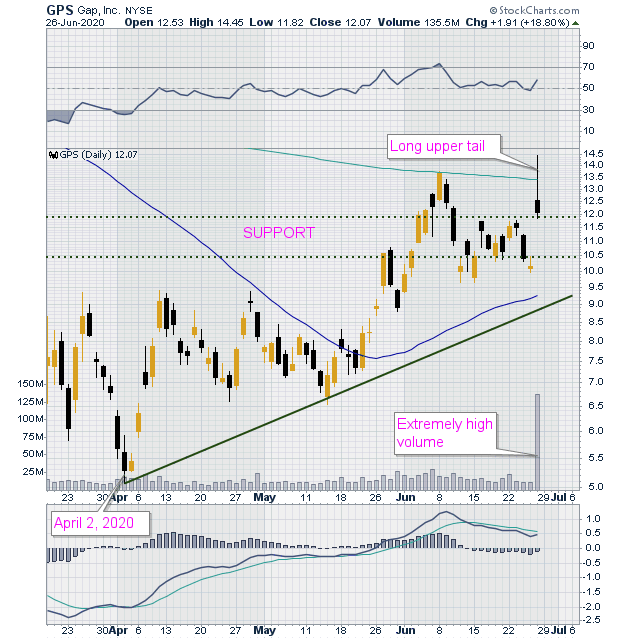
| Figure 2 is a short term daily chart of GPS, showing price activity from the low reached on April 2, 2020 to the closing price on June 26, 2020. A glance at the chart shows that price is in an uptrend. (See green trend line on the chart). Price is forming a series of higher highs and higher lows. |
|
| Figure 2. Daily chart for GPS. |
| Graphic provided by: StockCharts.com. |
| |
| On June 25, 2020, when price formed a doji, closing below the low of the prior day which formed a strong bearish candle, there was the possibility of a three-candle reversal forming if the close on the 26th of June was a strong bullish candle. But the news about the Yeezy/GPS collaboration drew wide attention to the stock. Price gapped up on extremely high volume. Even though price subsequently retreated during the trading day as traders sought to cash-in on the unusual price activity caused by the announcement, the gap up has created a new area of support. |
| The long upper tail on the bearish candle of June 26 is short term bearish. As long as price does not retreat to below the lows of the entire support area as marked on the chart (Figure 2), it still spells good news for the stock for future higher prices. |
Stella Osoba is a trader and financial writer. She is a frequent contributor to "Technical Analysis of Stocks and Commodities" magazine and "Traders.com Advantage" as well as other financial publications.
| E-mail address: | stellaosoba@gmail.com |
Click here for more information about our publications!
PRINT THIS ARTICLE

Request Information From Our Sponsors
- StockCharts.com, Inc.
- Candle Patterns
- Candlestick Charting Explained
- Intermarket Technical Analysis
- John Murphy on Chart Analysis
- John Murphy's Chart Pattern Recognition
- John Murphy's Market Message
- MurphyExplainsMarketAnalysis-Intermarket Analysis
- MurphyExplainsMarketAnalysis-Visual Analysis
- StockCharts.com
- Technical Analysis of the Financial Markets
- The Visual Investor
- VectorVest, Inc.
- Executive Premier Workshop
- One-Day Options Course
- OptionsPro
- Retirement Income Workshop
- Sure-Fire Trading Systems (VectorVest, Inc.)
- Trading as a Business Workshop
- VectorVest 7 EOD
- VectorVest 7 RealTime/IntraDay
- VectorVest AutoTester
- VectorVest Educational Services
- VectorVest OnLine
- VectorVest Options Analyzer
- VectorVest ProGraphics v6.0
- VectorVest ProTrader 7
- VectorVest RealTime Derby Tool
- VectorVest Simulator
- VectorVest Variator
- VectorVest Watchdog