HOT TOPICS LIST
- MACD
- Fibonacci
- RSI
- Gann
- ADXR
- Stochastics
- Volume
- Triangles
- Futures
- Cycles
- Volatility
- ZIGZAG
- MESA
- Retracement
- Aroon
INDICATORS LIST
LIST OF TOPICS
PRINT THIS ARTICLE
by Koos van der Merwe
In previous articles I have written about the JM investment strategy, and the R/G trading strategy. This article shows how to analyze the market and find a stock to trade short-term using the R/G strategy.
Position: Buy
Koos van der Merwe
Has been a technical analyst since 1969, and has worked as a futures and options trader with First Financial Futures in Johannesburg, South Africa.
PRINT THIS ARTICLE
STRATEGIES
End of Day Trading Using the Red Green Trading Strategy
01/09/03 02:46:48 PMby Koos van der Merwe
In previous articles I have written about the JM investment strategy, and the R/G trading strategy. This article shows how to analyze the market and find a stock to trade short-term using the R/G strategy.
Position: Buy
| In my previous article, "Analyzing the Market for a Winner," I discussed a very basic volume strategy to highlight those stocks that could perform well in the near future. Eyeballing the entire database of stocks to find these stocks can be painfully time consuming. Today, there are many programs on the Internet that will identify stocks with above average volumes, stocks that have gapped up, basically any buy or sell signal that you can think of. One failing is that after you have identified the stock, you still have to analyze it to see if it meets the R/G buy parameters. Fortunately, today most trading software allows you to write your own programs or customize standard indicators. I use Technfilter plus for all my calculations, and I am sure you can adapt the formula below to your own program. |
| Once I've targeted my stock, I find its trading symbol and pull up a daily stock chart. On it, I add the following: 1. Price Range % over last 5 days: 5- day moving average of (((High - Low )/ Low)*100) 2. Volume 3. 30-day simple moving average of the volume. 4. Today's volume minus the 30-day simple moving average of the volume. For the Red Green Buy strategy I need: 5. Stock high of 10 days ago 6. Today's closing price 7. Yesterday's closing price 8. Stock high of 11 days ago (You can easily implement a Red Green short strategy by substituting 6 days for the 10 days above.) Internal Movement Performance over 20 days: 9. Performance over the last 20 days. ([5] -[5] 20 days ago) / [5] 20 days ago. Filter: A. Strong Volume -- when Number 2 on my list is positive, or greater than zero. B. The Red Green buy signal-- when No. 6 > No. 5 and No. 7 < No. 8. C. Sort the results by Price Range % over last five days OR the greatest volume movement to get the stock to purchase for the best results. |

|
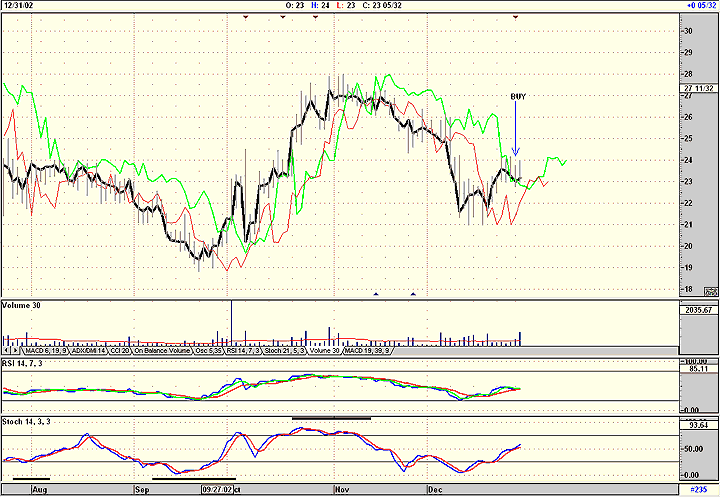
| BioReliance chosen by the Strategy as explained above. |
| Graphic provided by: AdvancedGET. |
| |
| The formula and strategy above are very simple, and will reduce the number of stocks you have to screen. This unfortunately, is a task you will never really get away from, but at least there will be less to go through. You could also reduce the number by including a filter that only looks at stocks less than $20, or whatever your choice is. Using this strategy on December 31, 2002, BioReliance came to my attention. This stock has good intraday movement, (I can daytrade it if I want to) and also good volume. The stock had broken above the Red Band of the R/G strategy, and had given a buy signal on above-average volume. My formula above calculated that the average daily movement in the share price between the high and the low of the day was 4.29% for the past week. |
| Because, I am not buying the share to invest, I do not look at a risk/reward ratio determined on an expected target price. Finally, I will always enter the share on a bid, and exit at market. I will exit on a 5% rising stop-loss signal. |
| Finally, as a short-term target, I will take the previous day's trading range and add it to my purchase price. I will also never trade against the trend suggested by the RSI or stochastic as shown in the chart, nor will I trade against the market trend. So if the market is falling, I will look for a short trade. If rising, I will go long. |
Has been a technical analyst since 1969, and has worked as a futures and options trader with First Financial Futures in Johannesburg, South Africa.
| Address: | 3256 West 24th Ave |
| Vancouver, BC | |
| Phone # for sales: | 6042634214 |
| E-mail address: | petroosp@gmail.com |
Click here for more information about our publications!
Comments
Date: 01/09/03Rank: 2Comment:
Date: 01/10/03Rank: 5Comment:

|

Request Information From Our Sponsors
- StockCharts.com, Inc.
- Candle Patterns
- Candlestick Charting Explained
- Intermarket Technical Analysis
- John Murphy on Chart Analysis
- John Murphy's Chart Pattern Recognition
- John Murphy's Market Message
- MurphyExplainsMarketAnalysis-Intermarket Analysis
- MurphyExplainsMarketAnalysis-Visual Analysis
- StockCharts.com
- Technical Analysis of the Financial Markets
- The Visual Investor
- VectorVest, Inc.
- Executive Premier Workshop
- One-Day Options Course
- OptionsPro
- Retirement Income Workshop
- Sure-Fire Trading Systems (VectorVest, Inc.)
- Trading as a Business Workshop
- VectorVest 7 EOD
- VectorVest 7 RealTime/IntraDay
- VectorVest AutoTester
- VectorVest Educational Services
- VectorVest OnLine
- VectorVest Options Analyzer
- VectorVest ProGraphics v6.0
- VectorVest ProTrader 7
- VectorVest RealTime Derby Tool
- VectorVest Simulator
- VectorVest Variator
- VectorVest Watchdog
