

HOT TOPICS LIST
- MACD
- Fibonacci
- RSI
- Gann
- ADXR
- Stochastics
- Volume
- Triangles
- Futures
- Cycles
- Volatility
- ZIGZAG
- MESA
- Retracement
- Aroon
INDICATORS LIST
LIST OF TOPICS
PRINT THIS ARTICLE
by Stella Osoba, CMT
In February 2020, Wells Fargo (WFC) agreed to pay $3 billion to settle criminal and civil charges which resulted from its fraudulent treatment of some bank customers over a 14-year period, from 2002 until 2016. Because of impossible sales targets set by senior executives, low-level staff opened millions of accounts in customers' names without their authorization. With the settlement behind them, is the worst over for this stock?
Position: N/A
Stella Osoba, CMT
Stella Osoba is a trader and financial writer. She is a frequent contributor to "Technical Analysis of Stocks and Commodities" magazine and "Traders.com Advantage" as well as other financial publications.
PRINT THIS ARTICLE
TECHNICAL ANALYSIS
The Three Billion Dollar Fraud
06/11/20 03:41:08 PMby Stella Osoba, CMT
In February 2020, Wells Fargo (WFC) agreed to pay $3 billion to settle criminal and civil charges which resulted from its fraudulent treatment of some bank customers over a 14-year period, from 2002 until 2016. Because of impossible sales targets set by senior executives, low-level staff opened millions of accounts in customers' names without their authorization. With the settlement behind them, is the worst over for this stock?
Position: N/A
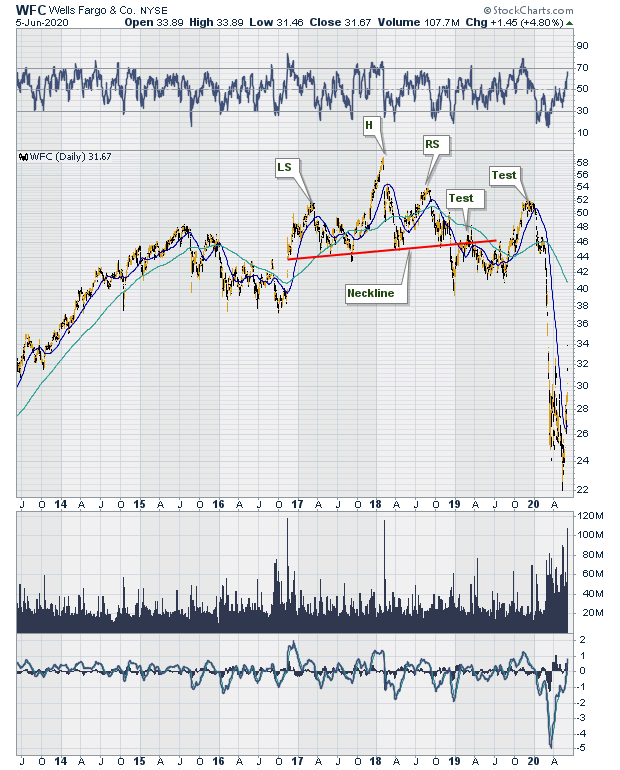
| With a current market capitalization of $129.85 billion, WFC is a large cap value stock. It is the fourth largest US bank with total assets of $1,927 billion. From 2017 until mid-2018, Figure 1 is a long term daily chart of WFC, showing it forming a large head-and-shoulders top. It broke the neckline in December 2018 (see red line on chart) and tested the break in February 2019. Then it traded sideways for several months, then broke above the prior test high. Its march upward was halted in November 2019 when it found resistance at the prior right shoulder of the head-and-shoulders pattern. |
|
| Figure 1. Daily chart for WFC. |
| Graphic provided by: StockCharts.com. |
| |
| WFC's price plunged along with the rest of the market from January to March 2020 amid the fallout from the Coronavirus pandemic. |
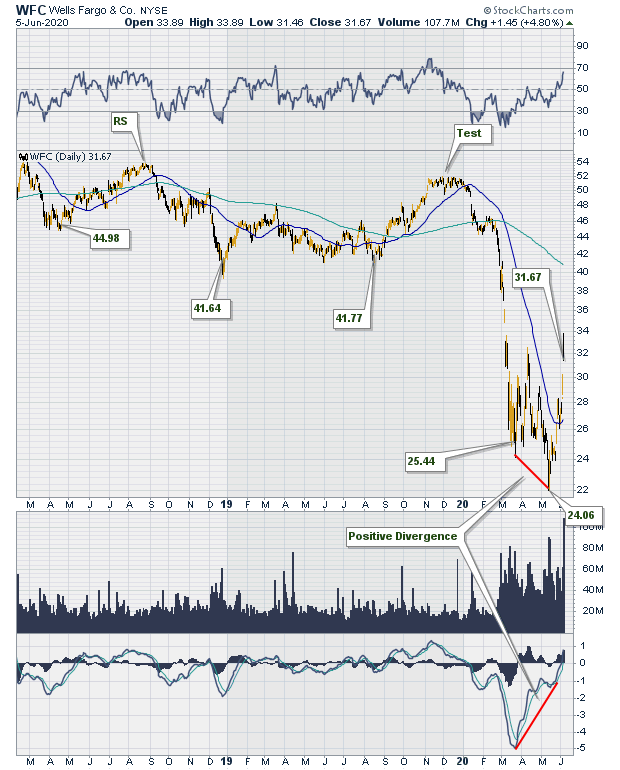
| Figure 2, which is another daily chart of WFC, shows about two years of price action. Price formed a low in March 2020 and a lower low in May 2020. But notice the positive divergence that price forms with the MACD which is in the panel below volume. A positive divergence occurs when price is making lower lows but the indicator is making higher lows. |
|
| Figure 2. Daily chart for WFC. |
| Graphic provided by: StockCharts.com. |
| |
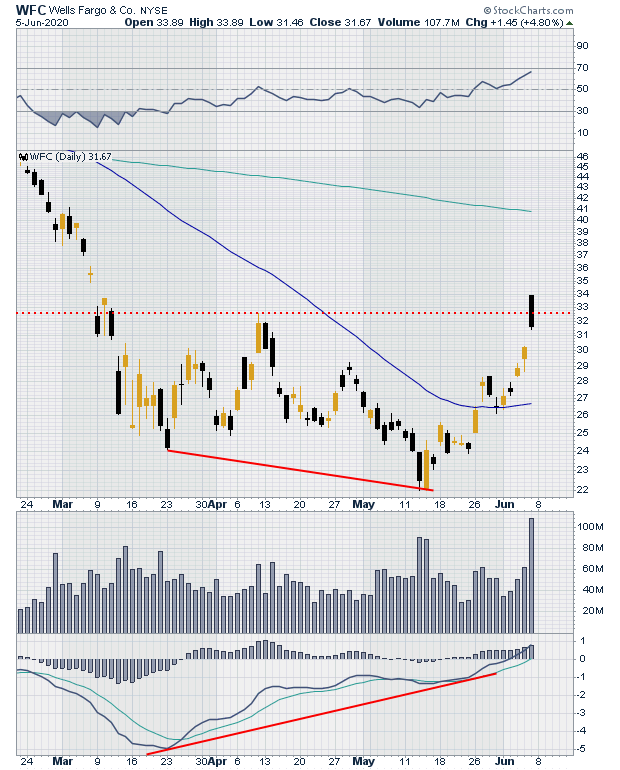
| Figure 3 is a closer view of daily price action. As price rises from its May 2020 lows, the 50-day moving average begins to turn. If the price rise continues, it will eventually turn upwards (remember a moving average is a lagging indicator). |
|
| Figure 3. Daily chart for WFC. |
| Graphic provided by: StockCharts.com. |
| |
| In the past week, price has moved steadily upwards, gapping up twice. The closing candle on Friday June 5, 2020 is a long bearish candle with price closing near its daily lows. This may mean near term bearish action. But with the overall picture looking bullish, it might be an opportunity to take a long position at lower prices. Remember, this post along with all my other posts are simply for educational purposes only. Markets can, and will, do anything. We can analyze price patterns, but we cannot predict with complete accuracy what price will do. No one can. |
Stella Osoba is a trader and financial writer. She is a frequent contributor to "Technical Analysis of Stocks and Commodities" magazine and "Traders.com Advantage" as well as other financial publications.
| E-mail address: | stellaosoba@gmail.com |
Click here for more information about our publications!
PRINT THIS ARTICLE

Request Information From Our Sponsors
- VectorVest, Inc.
- Executive Premier Workshop
- One-Day Options Course
- OptionsPro
- Retirement Income Workshop
- Sure-Fire Trading Systems (VectorVest, Inc.)
- Trading as a Business Workshop
- VectorVest 7 EOD
- VectorVest 7 RealTime/IntraDay
- VectorVest AutoTester
- VectorVest Educational Services
- VectorVest OnLine
- VectorVest Options Analyzer
- VectorVest ProGraphics v6.0
- VectorVest ProTrader 7
- VectorVest RealTime Derby Tool
- VectorVest Simulator
- VectorVest Variator
- VectorVest Watchdog
- StockCharts.com, Inc.
- Candle Patterns
- Candlestick Charting Explained
- Intermarket Technical Analysis
- John Murphy on Chart Analysis
- John Murphy's Chart Pattern Recognition
- John Murphy's Market Message
- MurphyExplainsMarketAnalysis-Intermarket Analysis
- MurphyExplainsMarketAnalysis-Visual Analysis
- StockCharts.com
- Technical Analysis of the Financial Markets
- The Visual Investor