

HOT TOPICS LIST
- MACD
- Fibonacci
- RSI
- Gann
- ADXR
- Stochastics
- Volume
- Triangles
- Futures
- Cycles
- Volatility
- ZIGZAG
- MESA
- Retracement
- Aroon
INDICATORS LIST
LIST OF TOPICS
PRINT THIS ARTICLE
by Stella Osoba, CMT
According to its first quarter earnings report, Vornado Realty Trust (VNO), the largest owner and manager of retail rental space in Manhattan collected only 53% of rent due from its retail tenants in April 2020. Among its other real estate businesses, VNO rents retail space to major well-known retail clients many of whom did not pay rent in April and are unlikely to pay rent in May amid the coronavirus lock down in New York City. This has pummeled the share price, causing its stock to decline over 50% in less than two months.
Position: N/A
Stella Osoba, CMT
Stella Osoba is a trader and financial writer. She is a frequent contributor to "Technical Analysis of Stocks and Commodities" magazine and "Traders.com Advantage" as well as other financial publications.
PRINT THIS ARTICLE
TRIANGLES
Can't Pay, Won't Pay!
05/29/20 02:19:23 PMby Stella Osoba, CMT
According to its first quarter earnings report, Vornado Realty Trust (VNO), the largest owner and manager of retail rental space in Manhattan collected only 53% of rent due from its retail tenants in April 2020. Among its other real estate businesses, VNO rents retail space to major well-known retail clients many of whom did not pay rent in April and are unlikely to pay rent in May amid the coronavirus lock down in New York City. This has pummeled the share price, causing its stock to decline over 50% in less than two months.
Position: N/A
| VNO is a mid cap Real Estate Investment Trust (REIT) that owns more than 2.4 million square feet of retail space in Manhattan, which makes it the among the largest owner and manager of street retail in Manhattan. Therefore, when up to half of those tenants miss a rental payment or two or more, it is likely to have a disproportionate effect on its stock price. Vornado has said that many of its tenants are seeking some form of rent relief since with the exception of grocery stores, they have been forced amidst the lockdown to close their street-front retail stores. Steve Roth, the company's CEO has called the share price decline a "gross exaggeration". It is therefore time we take a look at the stock's chart and look for clues, if any, that it can tell us about the future direction of price. |
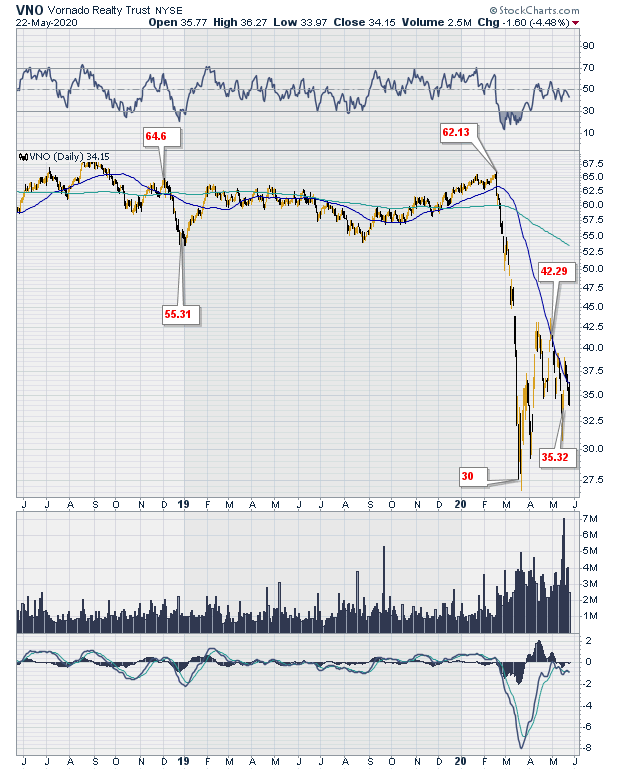
| Figure 1 is a daily chart, showing the deep plunge which happened in the stock's price from mid-February to mid-March 2020. Price was trading in the sixties in February 2020, before the plunge which touched a low of about $30, before rising to stage a sideways recovery at much lower prices than the highs it had seen at the beginning of the year. |
|
| Figure 1. Daily chart for VNO. |
| Graphic provided by: StockCharts.com. |
| |
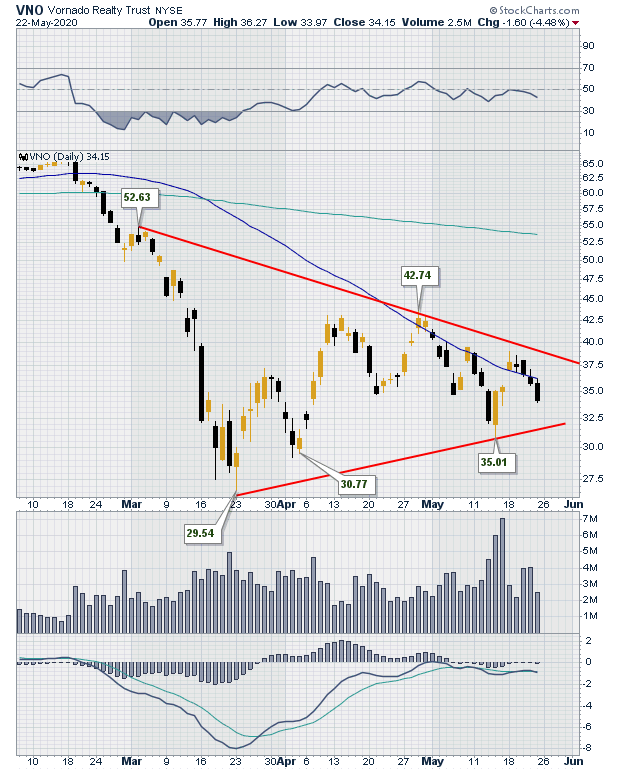
| Figure 2 is a daily chart showing a close-up of the sideways trading which has occurred since the March 2020 lows. We can see that price has formed a symmetrical triangle. It is bounded above and below by trend lines (see red lines on chart). The upper trend line is declining, the lower trend line is rising. Symmetrical triangles are commonly continuation patterns, but can also be reversals which means the direction of the breakout is important. |
|
| Figure 2. VNO Daily Chart Feb-May 2020. |
| Graphic provided by: StockCharts.com. |
| |
| It is possible that the stock will see lower prices before it sees higher prices, but it is times like these when it is best for one to wait to let the market tell you what it is going to do. Remember also that once a break out in either direction happens, it is also possible for price to retest the trend line it has recently broken out from before continuing on its eventual trend. Patience therefore, is often a most useful quality. |
| And the last word goes to Roth, who calls New York the business capital of the world and states, that it will come back, as it always has,"bigger and better". If this were true, it would be good news for VNO's share price. But remember that the CEO's job is be a cheerleader for his company. So pay more attention to the chart in your analysis. As always, let the market tell you what it will do. |
Stella Osoba is a trader and financial writer. She is a frequent contributor to "Technical Analysis of Stocks and Commodities" magazine and "Traders.com Advantage" as well as other financial publications.
| E-mail address: | stellaosoba@gmail.com |
Click here for more information about our publications!
Comments
Date:�06/19/20Rank:�4Comment:�

Request Information From Our Sponsors
- StockCharts.com, Inc.
- Candle Patterns
- Candlestick Charting Explained
- Intermarket Technical Analysis
- John Murphy on Chart Analysis
- John Murphy's Chart Pattern Recognition
- John Murphy's Market Message
- MurphyExplainsMarketAnalysis-Intermarket Analysis
- MurphyExplainsMarketAnalysis-Visual Analysis
- StockCharts.com
- Technical Analysis of the Financial Markets
- The Visual Investor
- VectorVest, Inc.
- Executive Premier Workshop
- One-Day Options Course
- OptionsPro
- Retirement Income Workshop
- Sure-Fire Trading Systems (VectorVest, Inc.)
- Trading as a Business Workshop
- VectorVest 7 EOD
- VectorVest 7 RealTime/IntraDay
- VectorVest AutoTester
- VectorVest Educational Services
- VectorVest OnLine
- VectorVest Options Analyzer
- VectorVest ProGraphics v6.0
- VectorVest ProTrader 7
- VectorVest RealTime Derby Tool
- VectorVest Simulator
- VectorVest Variator
- VectorVest Watchdog