

HOT TOPICS LIST
- MACD
- Fibonacci
- RSI
- Gann
- ADXR
- Stochastics
- Volume
- Triangles
- Futures
- Cycles
- Volatility
- ZIGZAG
- MESA
- Retracement
- Aroon
INDICATORS LIST
LIST OF TOPICS
PRINT THIS ARTICLE
by Stella Osoba, CMT
Sometimes it's useful to go back to basics to remind ourselves of classic chart patterns which may have receded in importance during the recent bull market, but which now seem to pop up with more consistency. One such pattern is the symmetrical triangle.
Position: N/A
Stella Osoba, CMT
Stella Osoba is a trader and financial writer. She is a frequent contributor to "Technical Analysis of Stocks and Commodities" magazine and "Traders.com Advantage" as well as other financial publications.
PRINT THIS ARTICLE
TRIANGLES
Symmetrical Triangles
05/20/20 12:20:42 PMby Stella Osoba, CMT
Sometimes it's useful to go back to basics to remind ourselves of classic chart patterns which may have receded in importance during the recent bull market, but which now seem to pop up with more consistency. One such pattern is the symmetrical triangle.
Position: N/A
| A symmetrical triangle is a continuation chart pattern. It consists of a downward sloping upper trend line and an upward sloping lower trend line. It is important to remember that a continuation pattern will likely leave the triangle in the direction that it entered. |
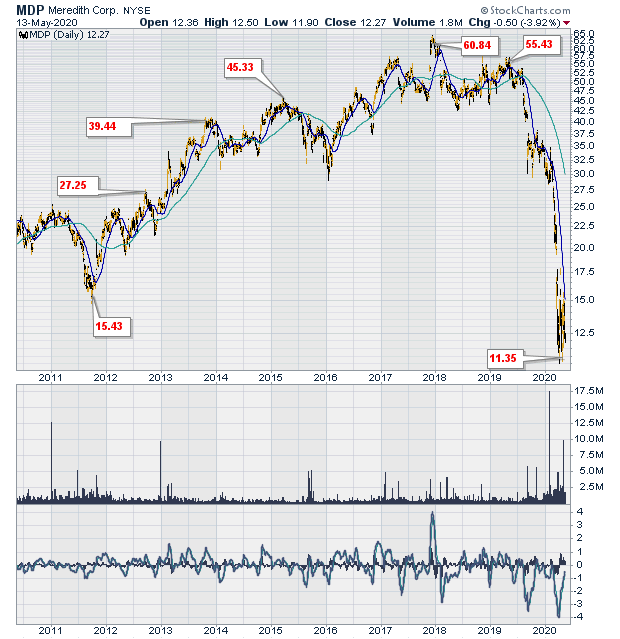
| To illustrate the pattern we shall use Meredith Corporation's (MDP) price chart. MDP is a small cap value stock. It is a diversified media company that owns several television stations as well as many well-known magazines. The last twelve months have seen its share price plunge from a high of $58.55 to a low of $10.01. |
| Figure 1 is a weekly long term chart of MDP showing the progress of its price. In 2011, it was trading for around $15. It proceeded to make higher highs in a multi-year uptrend, trading briefly for around $60 in 2018, then price formed a head and shoulders top. The break of the neckline marked the end to the uptrend for the stock. It proceeded to fall sharply, never pausing to test the neckline from below. |
|
| Figure 1. Weekly chart for MDP. |
| Graphic provided by: StockCharts.com. |
| |
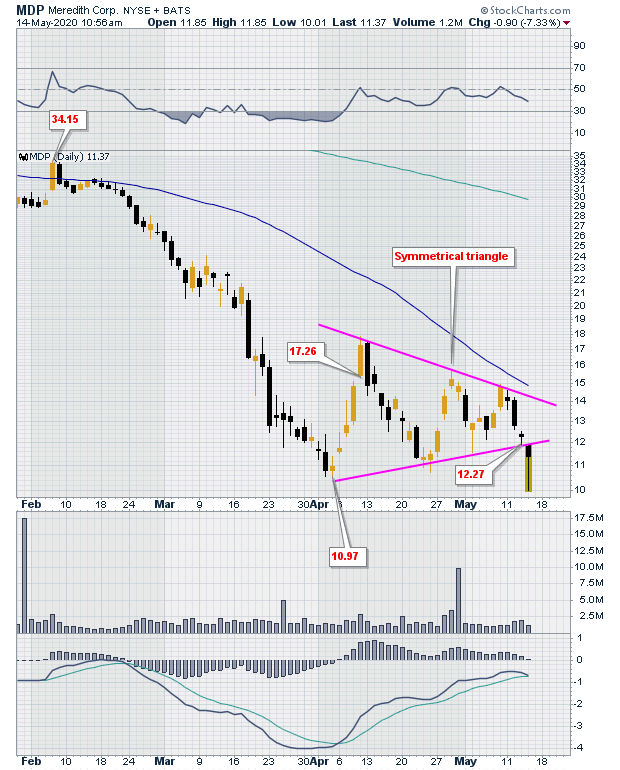
| Figure 2 is a daily chart of MDP showing the end of what might well be the first stage of the plunge as price traded sideways and formed a symmetrical triangle. It is tempting to look at the chart and imagine that because price lows are higher for each succeeding trough, that price is meeting support and therefore that the next price move will be up. The steepness of the preceding plunge, as well as the rising MACD might also reinforce this erroneous belief, but remember that when the MACD is rising and price lows are higher as is the case here, it is merely confirming what price is doing. Therefore, the correct thing to do is to wait for the market to show you what it will do. |
|
| Figure 2. Daily chart for MDP. |
| Graphic provided by: StockCharts.com. |
| |
| In this case, price breaks the lower trend line. It is therefore possible that the symmetrical triangle is acting as it should; like a confirmation pattern. But remember that the chart is the map, not the territory. The market will do what it will, not what it should. Be prepared for anything to happen. And also remember, everything is information and information is often useful. Failed patterns will be the subject of another article. |
Stella Osoba is a trader and financial writer. She is a frequent contributor to "Technical Analysis of Stocks and Commodities" magazine and "Traders.com Advantage" as well as other financial publications.
| E-mail address: | stellaosoba@gmail.com |
Click here for more information about our publications!
PRINT THIS ARTICLE

Request Information From Our Sponsors
- StockCharts.com, Inc.
- Candle Patterns
- Candlestick Charting Explained
- Intermarket Technical Analysis
- John Murphy on Chart Analysis
- John Murphy's Chart Pattern Recognition
- John Murphy's Market Message
- MurphyExplainsMarketAnalysis-Intermarket Analysis
- MurphyExplainsMarketAnalysis-Visual Analysis
- StockCharts.com
- Technical Analysis of the Financial Markets
- The Visual Investor
- VectorVest, Inc.
- Executive Premier Workshop
- One-Day Options Course
- OptionsPro
- Retirement Income Workshop
- Sure-Fire Trading Systems (VectorVest, Inc.)
- Trading as a Business Workshop
- VectorVest 7 EOD
- VectorVest 7 RealTime/IntraDay
- VectorVest AutoTester
- VectorVest Educational Services
- VectorVest OnLine
- VectorVest Options Analyzer
- VectorVest ProGraphics v6.0
- VectorVest ProTrader 7
- VectorVest RealTime Derby Tool
- VectorVest Simulator
- VectorVest Variator
- VectorVest Watchdog