

HOT TOPICS LIST
- MACD
- Fibonacci
- RSI
- Gann
- ADXR
- Stochastics
- Volume
- Triangles
- Futures
- Cycles
- Volatility
- ZIGZAG
- MESA
- Retracement
- Aroon
INDICATORS LIST
LIST OF TOPICS
PRINT THIS ARTICLE
by Stella Osoba, CMT
Travel is nearly at a standstill. One of the many companies negatively impacted by this is Airbnb. Recently, Redfin (RDFN) CEO Glenn Kelman said that the shut down of the vacation travel market has caused Airbnb owners to rush to offload their properties. Is this a plus for RDFN?
Position: N/A
Stella Osoba, CMT
Stella Osoba is a trader and financial writer. She is a frequent contributor to "Technical Analysis of Stocks and Commodities" magazine and "Traders.com Advantage" as well as other financial publications.
PRINT THIS ARTICLE
TECHNICAL ANALYSIS
Will AirBnB's Decline Help Redfin?
05/15/20 05:50:49 PMby Stella Osoba, CMT
Travel is nearly at a standstill. One of the many companies negatively impacted by this is Airbnb. Recently, Redfin (RDFN) CEO Glenn Kelman said that the shut down of the vacation travel market has caused Airbnb owners to rush to offload their properties. Is this a plus for RDFN?
Position: N/A
| RDFN is a small cap growth, residential real estate brokerage company. Its CEO recently announced plans to reenter the iBuying residential real estate market. Their RedfinNow segment can provide instant offers to people who wish to sell their vacation rental properties rather than wait for a market recovery. The company offers virtual tours of homes in many markets throughout the USA, so people can view the properties from the comfort of their residences. With Kelman describing the vacation real estate market as "toast" because of the global Coronavirus, he sees an opportunity as homeowners rush to offload properties. |
|
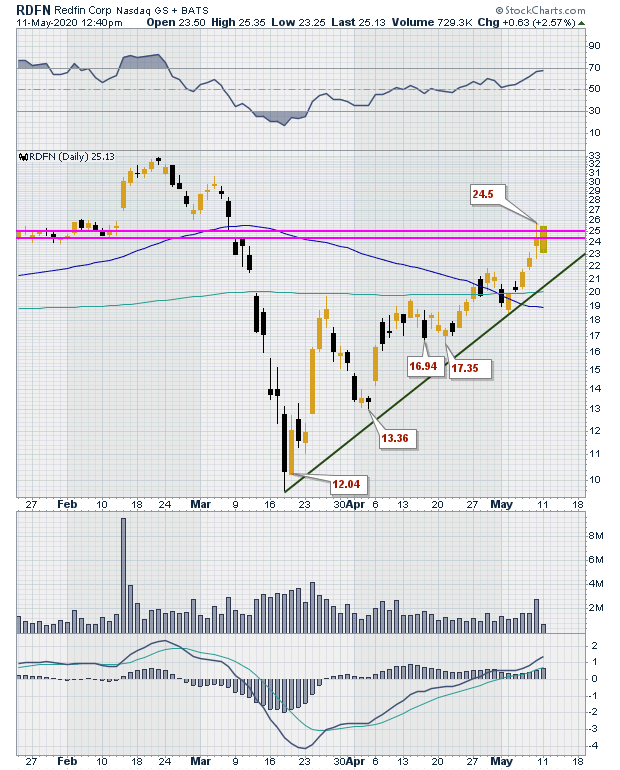
| Figure 1. Daily chart for RDFN. |
| Graphic provided by: StockCharts.com. |
| |
| Figure 1 is a daily chart of RDFN showing an uptrend in progress. The chart has risen from a low of $9.63 on March 18, 2020, to a high of $25.82 on May 8, 2020. Figure 1 shows the unbroken uptrend line. Price is testing the gap down formed on March 9, 2020 (Magenta lines on chart). A close above the gap will mean the whole of the area formed by the gap is now support. |
|
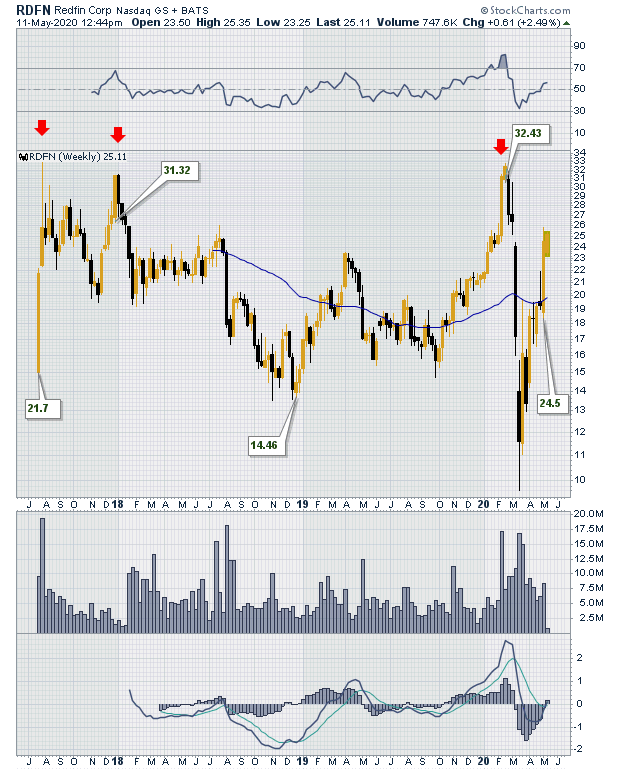
| Figure 2. Weekly chart for RDFN. |
| Graphic provided by: StockCharts.com. |
| |
| A look at a longer term weekly chart of RDFN (Figure 2) shows that RDFN traded near its highs of $32/33 three times prior. The first time was in its second week of trading when price briefly touched highs of $33.49. This was during the week of July 31, 2017. The second time it attempted to trade near its high was during the weeks of December 26, 2017, and January 2, 2018. The third attempt was made on February 18 ,2020, when price again traded just shy of $33. See the red arrows on Figure 2. |
| As price forms an impressive rally from March 2020 lows, the question to be asked is, will the stock manage to successfully break above prior highs? The strong price action we are seeing over the last couple of months could mean that any downward price movement will be simply a reaction in a new bull market. But with the world siting on the edge of economic collapse, it could well be that any reaction reaffirms that the bear hanging over the whole market is still alive and hungry. |
Stella Osoba is a trader and financial writer. She is a frequent contributor to "Technical Analysis of Stocks and Commodities" magazine and "Traders.com Advantage" as well as other financial publications.
| E-mail address: | stellaosoba@gmail.com |
Click here for more information about our publications!
PRINT THIS ARTICLE

Request Information From Our Sponsors
- StockCharts.com, Inc.
- Candle Patterns
- Candlestick Charting Explained
- Intermarket Technical Analysis
- John Murphy on Chart Analysis
- John Murphy's Chart Pattern Recognition
- John Murphy's Market Message
- MurphyExplainsMarketAnalysis-Intermarket Analysis
- MurphyExplainsMarketAnalysis-Visual Analysis
- StockCharts.com
- Technical Analysis of the Financial Markets
- The Visual Investor
- VectorVest, Inc.
- Executive Premier Workshop
- One-Day Options Course
- OptionsPro
- Retirement Income Workshop
- Sure-Fire Trading Systems (VectorVest, Inc.)
- Trading as a Business Workshop
- VectorVest 7 EOD
- VectorVest 7 RealTime/IntraDay
- VectorVest AutoTester
- VectorVest Educational Services
- VectorVest OnLine
- VectorVest Options Analyzer
- VectorVest ProGraphics v6.0
- VectorVest ProTrader 7
- VectorVest RealTime Derby Tool
- VectorVest Simulator
- VectorVest Variator
- VectorVest Watchdog