

HOT TOPICS LIST
- MACD
- Fibonacci
- RSI
- Gann
- ADXR
- Stochastics
- Volume
- Triangles
- Futures
- Cycles
- Volatility
- ZIGZAG
- MESA
- Retracement
- Aroon
INDICATORS LIST
LIST OF TOPICS
PRINT THIS ARTICLE
by Stella Osoba, CMT
Remdesivir is an antiviral medication developed by Gilead. The Federal Drug Administration recently authorized its use in COVID-19 patients because research has shown that it shortened recovery times in people seriously ill from the coronavirus. News of the clinical trials was already out weeks earlier and the trading in the company's stock reflected that. Trading behavior caused what I call an untidy chart to form.
Position: N/A
Stella Osoba, CMT
Stella Osoba is a trader and financial writer. She is a frequent contributor to "Technical Analysis of Stocks and Commodities" magazine and "Traders.com Advantage" as well as other financial publications.
PRINT THIS ARTICLE
TECHNICAL ANALYSIS
Untidy Charts
05/08/20 04:30:03 PMby Stella Osoba, CMT
Remdesivir is an antiviral medication developed by Gilead. The Federal Drug Administration recently authorized its use in COVID-19 patients because research has shown that it shortened recovery times in people seriously ill from the coronavirus. News of the clinical trials was already out weeks earlier and the trading in the company's stock reflected that. Trading behavior caused what I call an untidy chart to form.
Position: N/A
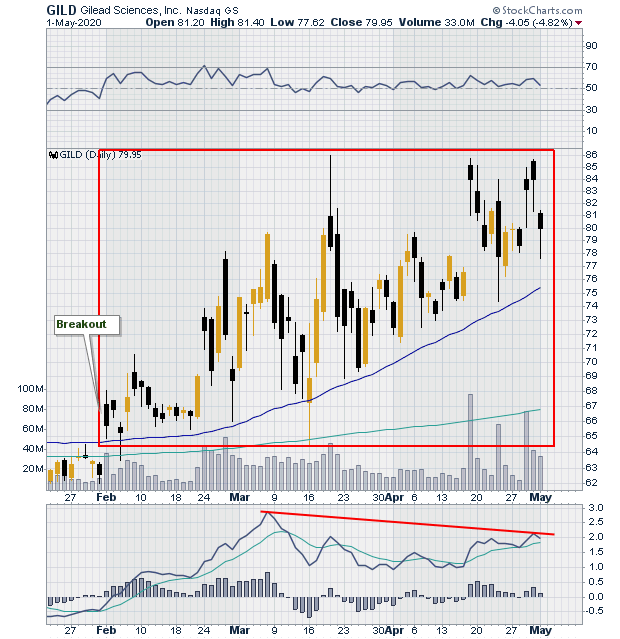
| This article is not for day traders. The chart I describe here with its high volatility may well be the exact right sort of chart for short term trading, but I prefer to hold my trades for weeks or months, very rarely days and never hours. Therefore, Figure 1, which is a daily chart of Gilead Sciences, Inc. (GILD) is not a chart that I find attractive to trade. |
|
| Figure 1. Daily chart for GILD (2019-220). |
| Graphic provided by: StockCharts.com. |
| |
| Figure 1 shows the daily price swings enclosed in the red box. Even though the slope of price is upwards as we can see from the 50-day moving average, the daily swings up and down are so wide that it is almost impossible to take a directional trade. Above average volume shows that the stock is being actively traded as news of the antiviral medication Remdesivir gathers attention. There is also a negative divergence with the MACD which is in the panel below price. While negative divergence is a bearish signal, it is not to be relied on. Price is always controlling. |
|
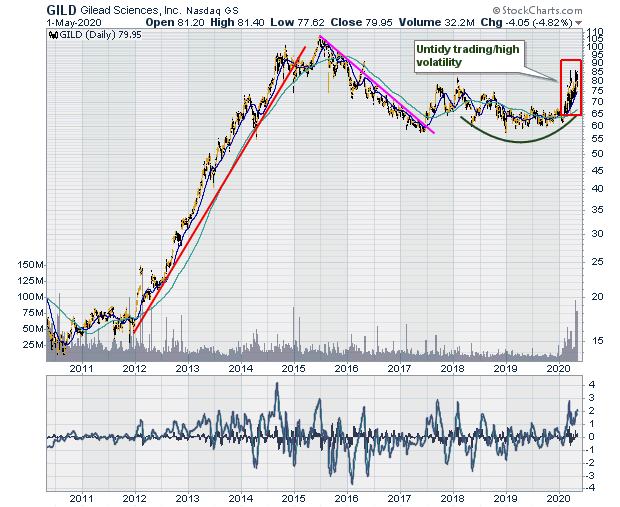
| Figure 2. Daily chart for GILD (2010-2020). |
| Graphic provided by: StockCharts.com. |
| |
| Figure 2 is a longer-term daily chart of GILD. The red line shows the uptrend which ran almost uninterrupted for three years, from 2012 until 2015 (much better price behavior from a swing traders point of view). Price then reacted to puncture the 200-day moving average before making a higher high in mid 2015. Thereafter, price declined in an orderly fashion, trading close to the declining 50-day moving average. Both prior trends, the uptrend and subsequent downtrend, were clear and directional trading was possible if you stuck to the direction of the trend. |
| However, in 2018, things changed. We can see from Figure 2 that price moved sideways forming a saucer pattern on the chart. This was not a problem, often such patterns will break out and resume trending behavior. But this did not happen.Figure 1 is a closer look at the area enclosed by the red box on Figure 2. |
| Even though the breakout is to the upside, the daily volatility, depicted on the chart by the very long bullish and bearish candles show that the price is being manipulated by very short term traders entering and exiting the position with speed. Price seems to rise for a day or so and then fall back just as quickly. I decided to write this to highlight how important it is to know your trading style and stick to it. Chasing after a trade because it is all over the news can only lead to losses if that is not a style you have mastered. |
Stella Osoba is a trader and financial writer. She is a frequent contributor to "Technical Analysis of Stocks and Commodities" magazine and "Traders.com Advantage" as well as other financial publications.
| E-mail address: | stellaosoba@gmail.com |
Click here for more information about our publications!
PRINT THIS ARTICLE

Request Information From Our Sponsors
- StockCharts.com, Inc.
- Candle Patterns
- Candlestick Charting Explained
- Intermarket Technical Analysis
- John Murphy on Chart Analysis
- John Murphy's Chart Pattern Recognition
- John Murphy's Market Message
- MurphyExplainsMarketAnalysis-Intermarket Analysis
- MurphyExplainsMarketAnalysis-Visual Analysis
- StockCharts.com
- Technical Analysis of the Financial Markets
- The Visual Investor
- VectorVest, Inc.
- Executive Premier Workshop
- One-Day Options Course
- OptionsPro
- Retirement Income Workshop
- Sure-Fire Trading Systems (VectorVest, Inc.)
- Trading as a Business Workshop
- VectorVest 7 EOD
- VectorVest 7 RealTime/IntraDay
- VectorVest AutoTester
- VectorVest Educational Services
- VectorVest OnLine
- VectorVest Options Analyzer
- VectorVest ProGraphics v6.0
- VectorVest ProTrader 7
- VectorVest RealTime Derby Tool
- VectorVest Simulator
- VectorVest Variator
- VectorVest Watchdog