HOT TOPICS LIST
- MACD
- Fibonacci
- RSI
- Gann
- ADXR
- Stochastics
- Volume
- Triangles
- Futures
- Cycles
- Volatility
- ZIGZAG
- MESA
- Retracement
- Aroon
INDICATORS LIST
LIST OF TOPICS
PRINT THIS ARTICLE
by Matt Blackman
Like many stocks, Cabot (CBT) enjoyed a nice run off October lows. It now looks like it is getting set to resume its long-term downtrend.
Position: N/A
Matt Blackman
Matt Blackman is a full-time technical and financial writer and trader. He produces corporate and financial newsletters, and assists clients in getting published in the mainstream media. He is the host of TradeSystemGuru.com. Matt has earned the Chartered Market Technician (CMT) designation. Find out what stocks and futures Matt is watching on Twitter at www.twitter.com/RatioTrade
PRINT THIS ARTICLE
CHART ANALYSIS
Cabot to Head Lower?
01/02/03 09:49:24 AMby Matt Blackman
Like many stocks, Cabot (CBT) enjoyed a nice run off October lows. It now looks like it is getting set to resume its long-term downtrend.
Position: N/A
| It has been a tough year for manufacturers. Specialty chemical producer Cabot Corporation is no exception. The stock is down 26% from the same time last year. After hitting a two-year low in October, it began to recover but there are signs that this recent surge may be running out of steam. |
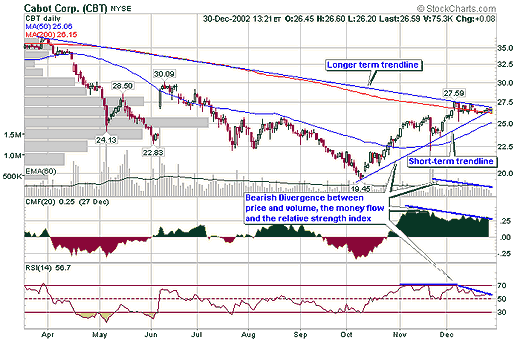
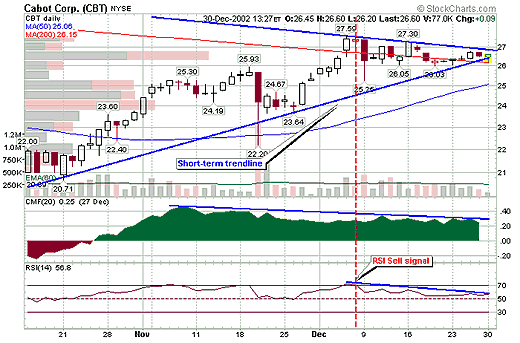
 Figure 1 - Longer-term daily chart of Cabot Corp. (CBT) showing both long-term and short-term trends as well as bearish divergence between price, volume, Chaikin money flow (CMF) and the relative strength index (RSI). In making buying and selling decisions, traders and investors are advised not to rely on one indicator alone but rather employ a two-pronged approach. When a momentum indicator such as the money flow or relative strength index generates a sell signal, as was the case with CBT on December 9 (see Figure 2), it is advisable to wait for the equity to break a trendline or moving average as confirmation before acting on it. Cabot appears poised to break both the short-term trendline and the 50-day moving average. |

|
| Figure 2 – Shorter-term daily chart of Cabot Corp. with CMF and the RSI. |
| Graphic provided by: StockCharts.com. |
| |
| Chaikin money flow (CMF) shows that money has been flowing out of the equity since early November and both CMF and the RSI show a bearish divergence with price. From a fundamental perspective, the price/earnings ratios are not exceptionally high for the equity but short interest in December was slightly above the threshold 5% of float, which should give long investors reason for pause. The company also admitted on December 6 that it is one of five companies being investigated by the European Union for alleged fixing of prices for tar pitch, creosote and naphthalene. |
| Like many manufacturers, Cabot relies on an economic recovery to grow revenues and earnings and the stock will suffer if such growth is not forthcoming in the coming quarter. Also of interest, more in passing than of real merit, is that the stock is covered by two (fundamental) analysts. One gives the stock a 'hold' rating, the other a 'strong buy.' As we know from experience gained in the last two years, one may be better off doing the opposite to what (fundamental) brokerage buy-side analysts advise. One last note, there is also a small possibility that the stock is currently forming a bullish pennant formation (from December 8 - 30). If it breaks the longer-term trendline (around $26.90) to the upside on high volume, all short bets are off, at least for the time being. Confirmations of weakness will include a break in the short-term trend line or 50-day moving average on high volume, a jump in short positions on January 9 and a surge in the Volatility Index (VIX). If this happens, to loosely borrow from a Beatle's song, you say "buy" and I say "sell, sell, sell." |
Matt Blackman is a full-time technical and financial writer and trader. He produces corporate and financial newsletters, and assists clients in getting published in the mainstream media. He is the host of TradeSystemGuru.com. Matt has earned the Chartered Market Technician (CMT) designation. Find out what stocks and futures Matt is watching on Twitter at www.twitter.com/RatioTrade
| Company: | TradeSystemGuru.com |
| Address: | Box 2589 |
| Garibaldi Highlands, BC Canada | |
| Phone # for sales: | 604-898-9069 |
| Fax: | 604-898-9069 |
| Website: | www.tradesystemguru.com |
| E-mail address: | indextradermb@gmail.com |
Traders' Resource Links | |
| TradeSystemGuru.com has not added any product or service information to TRADERS' RESOURCE. | |
Click here for more information about our publications!
Comments
Date: 01/07/03Rank: 3Comment:

Request Information From Our Sponsors
- StockCharts.com, Inc.
- Candle Patterns
- Candlestick Charting Explained
- Intermarket Technical Analysis
- John Murphy on Chart Analysis
- John Murphy's Chart Pattern Recognition
- John Murphy's Market Message
- MurphyExplainsMarketAnalysis-Intermarket Analysis
- MurphyExplainsMarketAnalysis-Visual Analysis
- StockCharts.com
- Technical Analysis of the Financial Markets
- The Visual Investor
- VectorVest, Inc.
- Executive Premier Workshop
- One-Day Options Course
- OptionsPro
- Retirement Income Workshop
- Sure-Fire Trading Systems (VectorVest, Inc.)
- Trading as a Business Workshop
- VectorVest 7 EOD
- VectorVest 7 RealTime/IntraDay
- VectorVest AutoTester
- VectorVest Educational Services
- VectorVest OnLine
- VectorVest Options Analyzer
- VectorVest ProGraphics v6.0
- VectorVest ProTrader 7
- VectorVest RealTime Derby Tool
- VectorVest Simulator
- VectorVest Variator
- VectorVest Watchdog
