

HOT TOPICS LIST
- MACD
- Fibonacci
- RSI
- Gann
- ADXR
- Stochastics
- Volume
- Triangles
- Futures
- Cycles
- Volatility
- ZIGZAG
- MESA
- Retracement
- Aroon
INDICATORS LIST
LIST OF TOPICS
PRINT THIS ARTICLE
by Fawad Razaqzada
Investors have been piling into equities despite the global economy being in a standstill. The rebound has been remarkable. The big question is what's going to happen next: a continuation higher (to a new all-time high) or another leg lower?
Position: N/A
Fawad Razaqzada
Fawad Razaqzada is an experienced analyst and economist having been involved in the financial markets since 2010 working for leading global FX and CFD brokerages. Having graduated with a degree in economics and leveraging years of financial market experience, Fawad provides retail and professional traders worldwide with succinct fundamental & technical analysis. In addition, he also offers premium trade signals to subscribers, and trading education to help shorten the learning curves of developing traders. He has also been trading on his personal account for many years. Follow Fawad on twitter @Trader_F_R or visit his website at TradingCandles.com.
PRINT THIS ARTICLE
TECHNICAL ANALYSIS
S&P Enters Key Resistance Zone After Strongest Rebound In History
04/23/20 04:14:03 PMby Fawad Razaqzada
Investors have been piling into equities despite the global economy being in a standstill. The rebound has been remarkable. The big question is what's going to happen next: a continuation higher (to a new all-time high) or another leg lower?
Position: N/A
| Thanks to the actions of governments and central banks in response to the coronavirus outbreak, the S&P 500 has now recovered more than 50% of its losses. It has been the most impressive rebound after a more than 20% drop in history. While it is impossible to say what will happen next with any certainty, it is always a good idea to be tactically ready for the main scenarios. That's my aim in this article. |
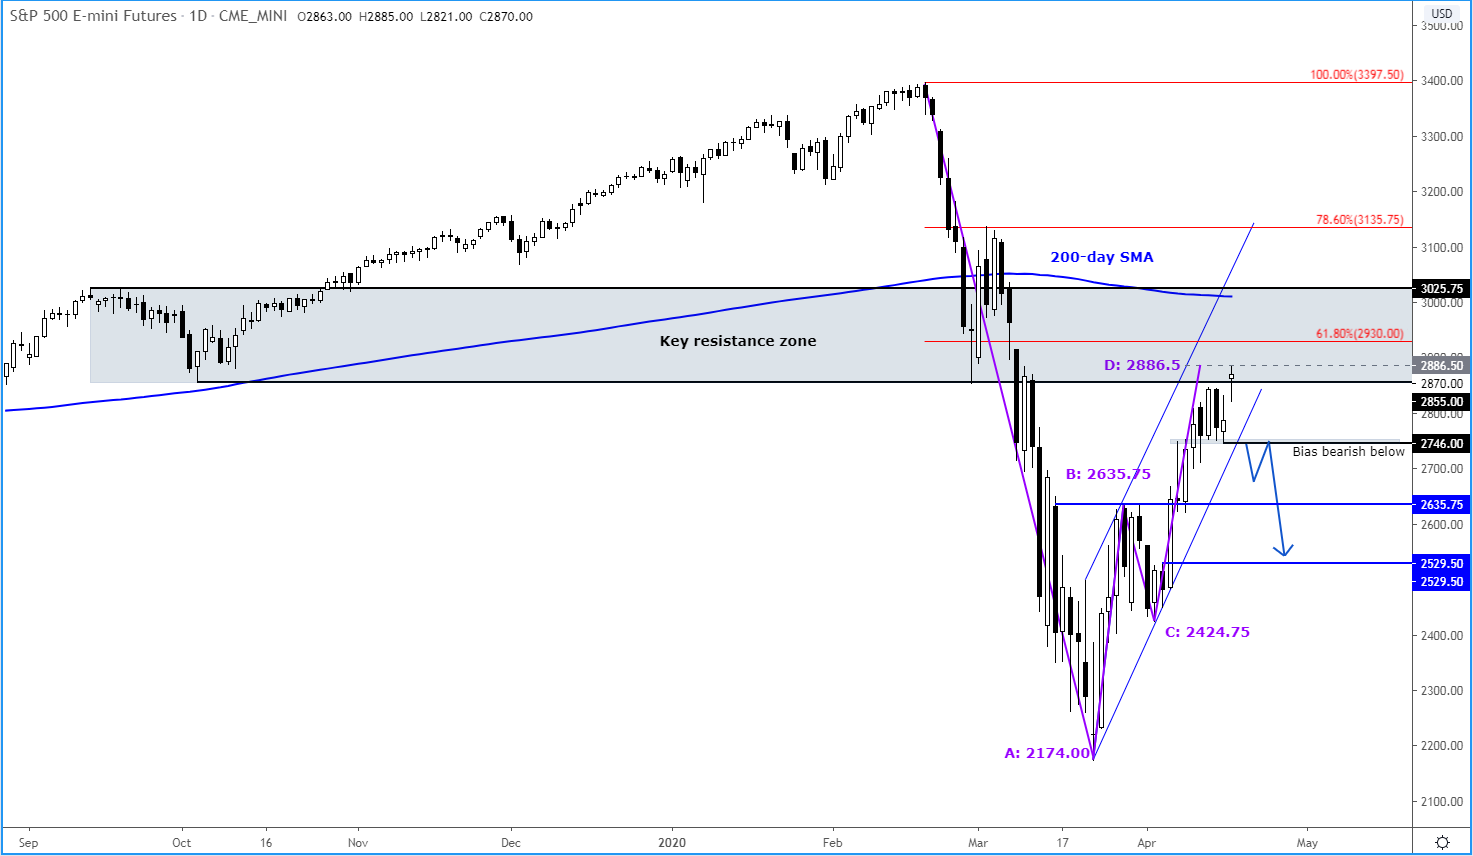
| Stocks such as Amazon and Netflix have done exceptionally well, both hitting new all-time highs. Ebay, Tesla and Microsoft have also been among the top gainers. Non-tech companies haven't done very well, though, with banks struggling due to interest rates being cut to zero and energy names have been hit because of the crude oil plunge. But now that the first quarter earnings season has started, we will find out exactly how US companies have fared during Q1 and what their outlook for the rest of the year will be. So, in the coming weeks, we will have more fundamental information to work with. But in so far as the S&P 500 is concerned, it faces the biggest technical test since the big drop, for it has now entered a key resistance zone (see the shaded area on the chart below). |
|
| Figure 1. Daily chart for S&P 500 E-mini Futures. |
| Graphic provided by: TradingView. |
| |
| The key technical points are as follows: 1. After a big fall, usually there is a big rebound which is underway right now. 2. The big question is whether this rebound is a V-shaped recovery to a new all-time high, or will there be a second and subsequent sell-offs to follow? 3. The shaded region was the last major support zone which, after a small bounce in February, broke down in March. This is now the most important resistance zone for the bears to defend. |
| Within this shaded region, lots of technical factors converge, including the 200-day moving average at 3021 which has now flattened, objectively telling us that the long-term trend is no longer bullish, especially since we are also below it. We also have the 61.8% Fibonacci retracement against the all-time high. If the markets did indeed form a major top earlier in the year, the next phase of the downtrend trend should resume around the 61.8 to 78.6 percent retracement levels. Otherwise, the bullish trend could continue to the 100% and potentially reach the 127.2% extension and therefore a new all-time high. Furthermore, there is a projected AB=CD move, which has now been completed at point D at 2887. In other words, there is a Bearish Gartley Pattern in the making. |
| Taking everything into account, the likelihood for another move lower may appear to be higher than a continuation to a new all-time high. However, for now, the trend is bullish and the buyers are in full control. So, for that reason, my base case scenario is that we may see further gains in the short-term. BUT, given the economic impact of covid-19 and the fact that the S&P is currently in the above-mentioned resistance zone means I will be quick to drop that view when, and if, there is a breakdown in the market structure of higher highs and higher lows in this phase of the uptrend. Specifically, the most recent low comes in at 2746 and this is the line in the sand for me. A potential break below this level could be the trigger for the bears to step back in. |
Fawad Razaqzada is an experienced analyst and economist having been involved in the financial markets since 2010 working for leading global FX and CFD brokerages. Having graduated with a degree in economics and leveraging years of financial market experience, Fawad provides retail and professional traders worldwide with succinct fundamental & technical analysis. In addition, he also offers premium trade signals to subscribers, and trading education to help shorten the learning curves of developing traders. He has also been trading on his personal account for many years. Follow Fawad on twitter @Trader_F_R or visit his website at TradingCandles.com.
| Title: | Financial Market Analyst |
| Company: | TradingCandles.com |
| London, | |
| Website: | tradingcandles.com |
| E-mail address: | fawad.razaqzada@hotmail.co.uk |
Traders' Resource Links | |
| TradingCandles.com has not added any product or service information to TRADERS' RESOURCE. | |
Click here for more information about our publications!
PRINT THIS ARTICLE

Request Information From Our Sponsors
- VectorVest, Inc.
- Executive Premier Workshop
- One-Day Options Course
- OptionsPro
- Retirement Income Workshop
- Sure-Fire Trading Systems (VectorVest, Inc.)
- Trading as a Business Workshop
- VectorVest 7 EOD
- VectorVest 7 RealTime/IntraDay
- VectorVest AutoTester
- VectorVest Educational Services
- VectorVest OnLine
- VectorVest Options Analyzer
- VectorVest ProGraphics v6.0
- VectorVest ProTrader 7
- VectorVest RealTime Derby Tool
- VectorVest Simulator
- VectorVest Variator
- VectorVest Watchdog
- StockCharts.com, Inc.
- Candle Patterns
- Candlestick Charting Explained
- Intermarket Technical Analysis
- John Murphy on Chart Analysis
- John Murphy's Chart Pattern Recognition
- John Murphy's Market Message
- MurphyExplainsMarketAnalysis-Intermarket Analysis
- MurphyExplainsMarketAnalysis-Visual Analysis
- StockCharts.com
- Technical Analysis of the Financial Markets
- The Visual Investor