

HOT TOPICS LIST
- MACD
- Fibonacci
- RSI
- Gann
- ADXR
- Stochastics
- Volume
- Triangles
- Futures
- Cycles
- Volatility
- ZIGZAG
- MESA
- Retracement
- Aroon
INDICATORS LIST
LIST OF TOPICS
PRINT THIS ARTICLE
by Stella Osoba, CMT
The National Institute for Health (NIH) and the Foundation for the NIH (FNIH) announced on April 17, 2020 via a news release that they are bringing together sixteen of the leading biopharmaceutical companies in conjunction with other national and international agencies to develop "an international strategy for a coordinated research response to the COVID-19 pandemic." One of these leading pharmaceutical companies is Eli Lilly and Company (LLY).
Position: N/A
Stella Osoba, CMT
Stella Osoba is a trader and financial writer. She is a frequent contributor to "Technical Analysis of Stocks and Commodities" magazine and "Traders.com Advantage" as well as other financial publications.
PRINT THIS ARTICLE
TECHNICAL ANALYSIS
Eli Lilly
04/30/20 04:07:21 PMby Stella Osoba, CMT
The National Institute for Health (NIH) and the Foundation for the NIH (FNIH) announced on April 17, 2020 via a news release that they are bringing together sixteen of the leading biopharmaceutical companies in conjunction with other national and international agencies to develop "an international strategy for a coordinated research response to the COVID-19 pandemic." One of these leading pharmaceutical companies is Eli Lilly and Company (LLY).
Position: N/A
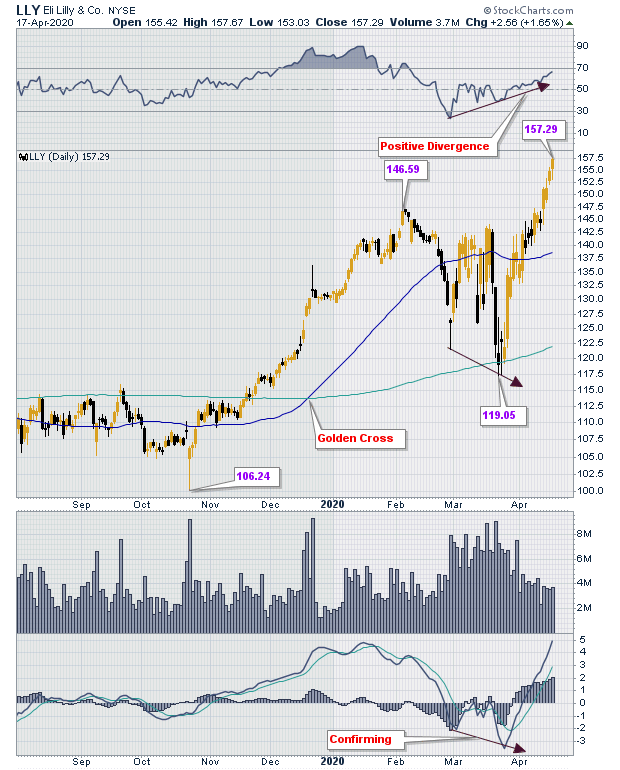
| LLY is a large cap growth company in the health care sector. On April 14, 2020, its stock traded at new highs of $151.55, reacting from a low of $117.00 in its most recent downturn on March 23, 2020. Figure 1 is a daily chart of LLY showing that in our current volatile market, with the majority of stocks making new lows, LLY is one of the few stocks currently in an uptrend. After forming a W shaped low, LLY's price has exceeded that of the prior high of $147.11 reached on February 6, 2020 to form a new price high. The stock closed at $157.29 on April 17, 2020. |
|
| Figure 1. Daily chart for LLY. |
| Graphic provided by: StockCharts.com. |
| |
| Figure 1 shows many things positive about the price behavior of this stock. On December 19, 2019, the chart shows a golden cross which is when the 50-day moving average moves above the 200-day moving average. This is a bullish signal. The stock continued to perform well until February 5, 2020 when stock markets were roiled by the news of the COVID-19 pandemic. Following a fast and sweeping fall in share prices which took LLY to a low of $117.06 on March 23, 2020, price recovered to form an impressive rally. LLY's close on April 17, 2020, as Figure 1 shows, was at $157.29. |
| Apart from the golden cross, there were early signs of strength in LLY's price. The panel above price on the chart is the RSI which shows a positive divergence with price. A positive divergence happens when price makes lower lows but the indicator makes higher lows. This can be a bullish signal. The bullishness would have been tempered by the MACD which is in the panel below price. While the RSI was forming a bullish divergence, the MACD was confirming price by also making a lower low. Which signal should one have led with? Price. Always price. When unsure it is best to wait for more information. |
| Another bullish signal given early on was in the behavior of the moving averages. Above we had said that a golden cross formed. It is interesting to note that throughout the period when a majority of stocks were dipping into bear market territory and slicing through their 200-day moving averages, LLY stayed consistently above its 200-day moving average. The 50-day moving average also stayed above the 200-day moving average which is bullish. |
| So what next for price? LLY is trading at new highs. It is likely that there will be a reaction down to at least the 50-day moving average in the coming days or weeks. Were LLY and/or the NIH to announce in the coming months that a vaccine for COVID-19 or some other treatment for those with severe forms of the illness had been successfully put through clinical trials, then the sky is likely to be the limit for this stock. But betting on an outcome which is uncertain is very risky. Not least because at least 15 other large biotech companies and numerous smaller ones are racing to find the cure or a vaccine for the pandemic. Only trade the stock when the technicals look right. Going in at new highs may not be a risk worth taking in a market as volatile as the one we are currently in. |
Stella Osoba is a trader and financial writer. She is a frequent contributor to "Technical Analysis of Stocks and Commodities" magazine and "Traders.com Advantage" as well as other financial publications.
| E-mail address: | stellaosoba@gmail.com |
Click here for more information about our publications!
PRINT THIS ARTICLE

Request Information From Our Sponsors
- StockCharts.com, Inc.
- Candle Patterns
- Candlestick Charting Explained
- Intermarket Technical Analysis
- John Murphy on Chart Analysis
- John Murphy's Chart Pattern Recognition
- John Murphy's Market Message
- MurphyExplainsMarketAnalysis-Intermarket Analysis
- MurphyExplainsMarketAnalysis-Visual Analysis
- StockCharts.com
- Technical Analysis of the Financial Markets
- The Visual Investor
- VectorVest, Inc.
- Executive Premier Workshop
- One-Day Options Course
- OptionsPro
- Retirement Income Workshop
- Sure-Fire Trading Systems (VectorVest, Inc.)
- Trading as a Business Workshop
- VectorVest 7 EOD
- VectorVest 7 RealTime/IntraDay
- VectorVest AutoTester
- VectorVest Educational Services
- VectorVest OnLine
- VectorVest Options Analyzer
- VectorVest ProGraphics v6.0
- VectorVest ProTrader 7
- VectorVest RealTime Derby Tool
- VectorVest Simulator
- VectorVest Variator
- VectorVest Watchdog