

HOT TOPICS LIST
- MACD
- Fibonacci
- RSI
- Gann
- ADXR
- Stochastics
- Volume
- Triangles
- Futures
- Cycles
- Volatility
- ZIGZAG
- MESA
- Retracement
- Aroon
INDICATORS LIST
LIST OF TOPICS
PRINT THIS ARTICLE
by Stella Osoba, CMT
As of April 12, 2020, the COVID-19 pandemic has resulted in over half a million cases in the US and over 20 thousand deaths. While these numbers look set to climb higher, governments around the world have taken unprecedented actions to try to slow the spread. Such actions include the Center for Disease Control's (CDC) No Sail Order for the cruise industry. With no revenue coming in and no access to stimulus funds, how will these cruise lines stay afloat? Remember, sentiment drives prices and with that in mind, let's take a look at the charts of three major cruise liners.
Position: N/A
Stella Osoba, CMT
Stella Osoba is a trader and financial writer. She is a frequent contributor to "Technical Analysis of Stocks and Commodities" magazine and "Traders.com Advantage" as well as other financial publications.
PRINT THIS ARTICLE
TECHNICAL ANALYSIS
What Now For The Much Maligned Cruise Industry?
04/23/20 03:59:48 PMby Stella Osoba, CMT
As of April 12, 2020, the COVID-19 pandemic has resulted in over half a million cases in the US and over 20 thousand deaths. While these numbers look set to climb higher, governments around the world have taken unprecedented actions to try to slow the spread. Such actions include the Center for Disease Control's (CDC) No Sail Order for the cruise industry. With no revenue coming in and no access to stimulus funds, how will these cruise lines stay afloat? Remember, sentiment drives prices and with that in mind, let's take a look at the charts of three major cruise liners.
Position: N/A
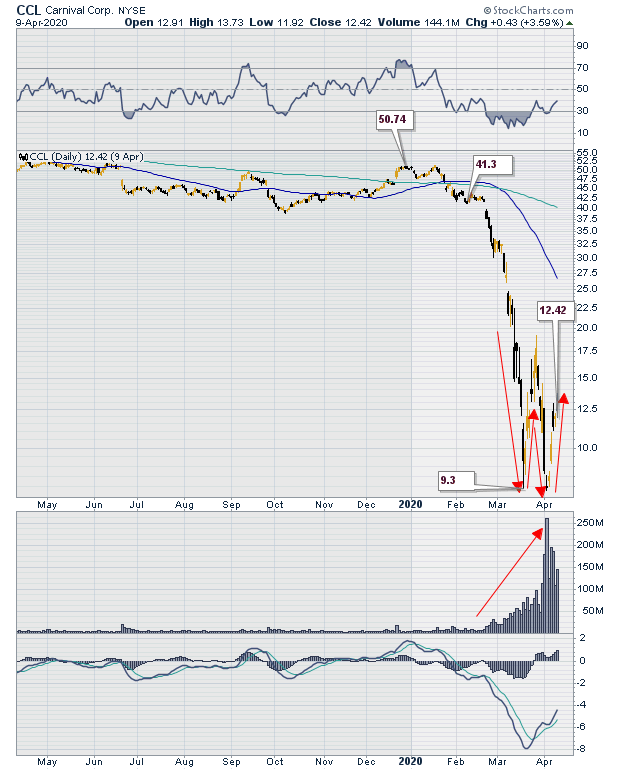
| Carnival Corporation (CCL) is a mid-cap value stock. Its stock price has fallen from a high of $66.40 reached on January 30, 2018, to a low of $7.80 reached on April 2, 2020. Figure 1 is a daily chart of the stock price showing the plunge in the value of the stock. Since the CDC announced its "No Sail Order" on March 14, 2020, the stock has begun to form a W pattern on heavy volume. Technically, this is often a positive, but with no income coming in and a heavy debt load, it is hard to see how the price can sustain any significant increases. |
|
| Figure 1. Daily chart for CCL. |
| Graphic provided by: StockCharts.com. |
| |
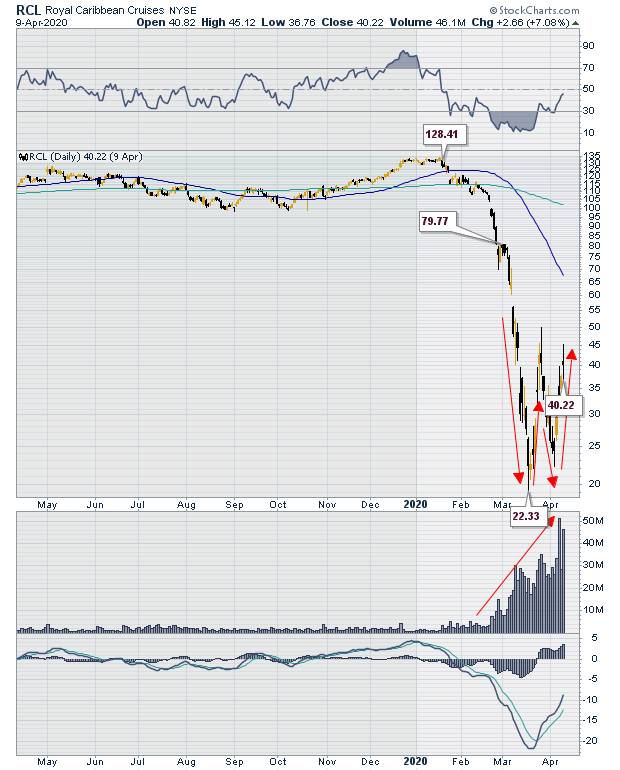
| Royal Caribbean Cruises Ltd (RCL) is another mid-cap value stock and a major player in the cruise line industry owning with its partner brands a combined total of 50 ships. With the pandemic and consequent CDC "No Sail Order", many of these ships will be on hot lay up scenarios. This means that many of the ships will be manned by a full crew, running power and systems and maintaining the vessel. This is done so that the vessel is ready to return to service almost immediately. But it is not cheap. A recent SEC filing by CCL said that a warm lay up costs between $2 to $3 million for each of its vessels. Figure 2 shows a chart of RCL. We can see the same W pattern we had observed in Figure 1. Does this mean the stock is ready for a move higher? Not on the fundamentals. Why would the stock move higher when the company has no revenue and likely has to borrow to maintain its vessels? Technicals can be right and they can be wrong. In situations like this, haste is the enemy. Wait for the market to show you what it will do. Signals can always fail. But since sentiment drives price, the "Why" is often irrelevant. |
|
| Figure 2. Daily chart for RCL. |
| Graphic provided by: StockCharts.com. |
| |
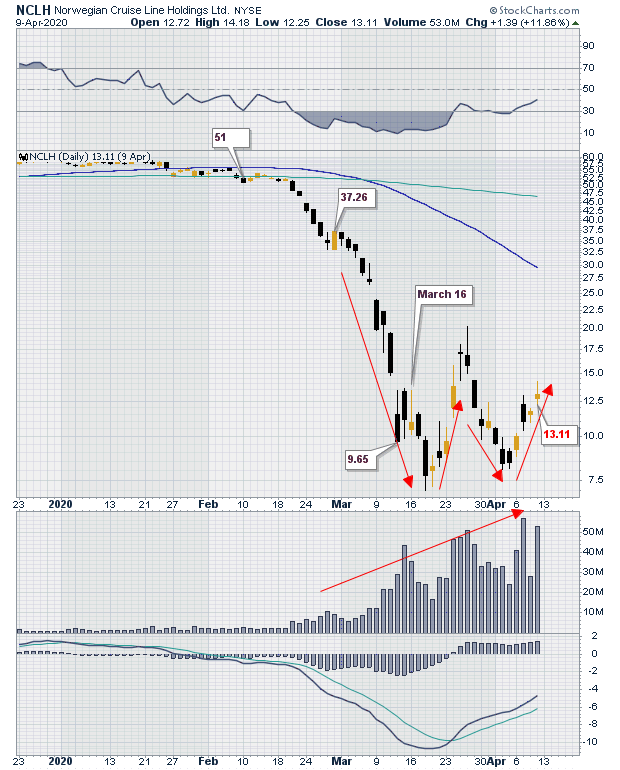
| The third chart we will look at is that of Norwegian Cruise Line Holdings Ltd (NCLH). Figure 3 is a closer look at the W formed by price on the daily chart. Often a W signals a bottom, but caution is to be heeded because we are in unprecedented times. With a market cap of $2.8 billion as of the close on April 10, 2020, this is the smallest of the three. It is therefore a small-cap value stock. But it is interesting how all three stocks have formed similar chart patterns. Also notice the behavior of volume which declines when price dips at the two lows of the W formation and rises with price. |
|
| Figure 3. Daily chart for NCLH. |
| Graphic provided by: StockCharts.com. |
| |
| Stock prices are forward looking, so much of the bad news might have already been discounted by the market. But with no income and no certainty that the CDC will lift the "No Sail Order" after 100 days, the lack of revenue for this industry if it persists might result in forced bankruptcies. Where that to happen, no chart pattern will be worth trading. |
Stella Osoba is a trader and financial writer. She is a frequent contributor to "Technical Analysis of Stocks and Commodities" magazine and "Traders.com Advantage" as well as other financial publications.
| E-mail address: | stellaosoba@gmail.com |
Click here for more information about our publications!
PRINT THIS ARTICLE

Request Information From Our Sponsors
- StockCharts.com, Inc.
- Candle Patterns
- Candlestick Charting Explained
- Intermarket Technical Analysis
- John Murphy on Chart Analysis
- John Murphy's Chart Pattern Recognition
- John Murphy's Market Message
- MurphyExplainsMarketAnalysis-Intermarket Analysis
- MurphyExplainsMarketAnalysis-Visual Analysis
- StockCharts.com
- Technical Analysis of the Financial Markets
- The Visual Investor
- VectorVest, Inc.
- Executive Premier Workshop
- One-Day Options Course
- OptionsPro
- Retirement Income Workshop
- Sure-Fire Trading Systems (VectorVest, Inc.)
- Trading as a Business Workshop
- VectorVest 7 EOD
- VectorVest 7 RealTime/IntraDay
- VectorVest AutoTester
- VectorVest Educational Services
- VectorVest OnLine
- VectorVest Options Analyzer
- VectorVest ProGraphics v6.0
- VectorVest ProTrader 7
- VectorVest RealTime Derby Tool
- VectorVest Simulator
- VectorVest Variator
- VectorVest Watchdog