HOT TOPICS LIST
- MACD
- Fibonacci
- RSI
- Gann
- ADXR
- Stochastics
- Volume
- Triangles
- Futures
- Cycles
- Volatility
- ZIGZAG
- MESA
- Retracement
- Aroon
INDICATORS LIST
LIST OF TOPICS
PRINT THIS ARTICLE
by Stella Osoba, CMT
"We're all sick and the kids' schools are closed, so we're all home. And it's raining. And the stores are out of toilet paper and we have seven butts to wipe and no toilet paper to be found," so said the celebrity actress and mother of seven, Tori Spelling. The toilet paper shortage was real. Even the Newport Oregon Police Department begged its residents to stop calling them because there was no toilet paper in the shops. So why is this a technical analysis story? Because the manufacturers of toilet paper deserve a look in this volatile and turbulent market.
Position: N/A
Stella Osoba, CMT
Stella Osoba is a trader and financial writer. She is a frequent contributor to "Technical Analysis of Stocks and Commodities" magazine and "Traders.com Advantage" as well as other financial publications.
PRINT THIS ARTICLE
TECHNICAL ANALYSIS
Toilet Paper Shortages in the Age of COVID-19
04/16/20 02:59:13 PMby Stella Osoba, CMT
"We're all sick and the kids' schools are closed, so we're all home. And it's raining. And the stores are out of toilet paper and we have seven butts to wipe and no toilet paper to be found," so said the celebrity actress and mother of seven, Tori Spelling. The toilet paper shortage was real. Even the Newport Oregon Police Department begged its residents to stop calling them because there was no toilet paper in the shops. So why is this a technical analysis story? Because the manufacturers of toilet paper deserve a look in this volatile and turbulent market.
Position: N/A
| Procter & Gamble Co. (PG) is one of the leading manufacturers of toilet paper in not only the US, but in the world. Toilet paper has become a symbol of the panic buying caused by the Covid-19 pandemic which has resulted in the hunkering down of almost half of the world's population. It is not as if people suddenly are using more toilet paper, but the panic is causing people to reach for an item that has come to symbolize the pandemic. With people scooping up rolls of toilet paper and emptying shelves as soon as they are restocked, companies further up the supply chain are having to adjust to the increased demand, putting strain on supply chains and possibly also increasing profits for some companies. |
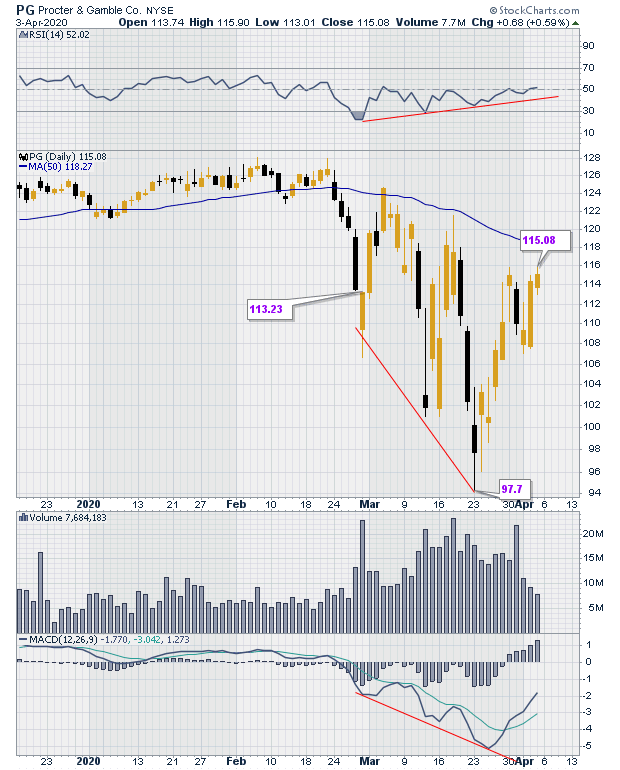
| As one of the largest manufacturers of toilet paper and other essential household durable items, it is interesting to look at how the stock price of this company has responded in this bear market. Figure 1 is a daily chart of PG clearly showing the break below the 50-day moving average when news of the pandemic swept around the world. The stock price made a series of lower lows in line with the wider market. But it is interesting to note the divergence that appeared with RSI while the stock was falling. Price was making lower lows, but RSI was not confirming. The MACD, which is represented in the lowest panel under the price chart, is confirming price however. |

|
| Figure 1. Daily chart for PG. |
| Graphic provided by: StockCharts.com. |
| |
| On March 23, 2020, price recovered from the low of $94.34 to close at $97.70. The current leg up has seen a continued recovery in price to a current close of $115.08. In the early stages of a bear market, consumer staples do well, or less poorly, than the general market. Companies like PG manufacture goods that people have to buy, like toilet paper. Therefore, their stocks tend to hold up well in environments such as these. |
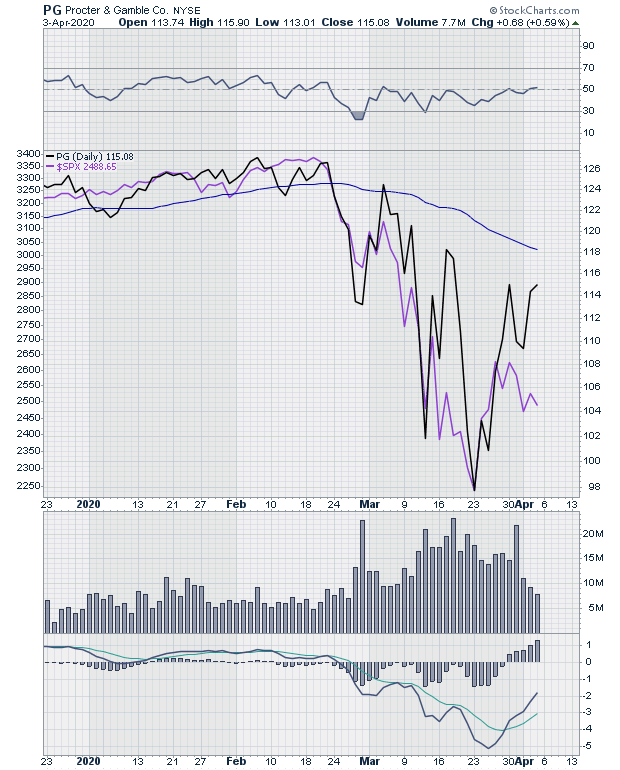
| Figure 2 is a line chart of PG (black line) and the S&P 500 (Purple line). The chart shows that though both the S&P 500 and P&G suffered extensive declines, P&G made sharper swings to the upside. A word of caution though: even though P&G is performing less badly than the S&P 500 we are still in a bear market, which means declines for the majority of stocks. P&G is no exception. It is trading below both its 50-day and 200-day moving averages. The appearance of a death cross (when the 200-day moving average moves below the 5- day moving average) is not reassuring for a long trade. Also, P&G has continued to make lower highs which is a bearish signal. |

|
| Figure 2. Daily chart for PG vs. SPX. |
| Graphic provided by: StockCharts.com. |
| |
| Knowing how sectors perform in different market environments is an important skill to have. Consumer staples tend to hold up better than other sectors in the early stages of a bear market, which is where we currently are. |
Stella Osoba is a trader and financial writer. She is a frequent contributor to "Technical Analysis of Stocks and Commodities" magazine and "Traders.com Advantage" as well as other financial publications.
| E-mail address: | stellaosoba@gmail.com |
Click here for more information about our publications!
PRINT THIS ARTICLE

Request Information From Our Sponsors
- StockCharts.com, Inc.
- Candle Patterns
- Candlestick Charting Explained
- Intermarket Technical Analysis
- John Murphy on Chart Analysis
- John Murphy's Chart Pattern Recognition
- John Murphy's Market Message
- MurphyExplainsMarketAnalysis-Intermarket Analysis
- MurphyExplainsMarketAnalysis-Visual Analysis
- StockCharts.com
- Technical Analysis of the Financial Markets
- The Visual Investor
- VectorVest, Inc.
- Executive Premier Workshop
- One-Day Options Course
- OptionsPro
- Retirement Income Workshop
- Sure-Fire Trading Systems (VectorVest, Inc.)
- Trading as a Business Workshop
- VectorVest 7 EOD
- VectorVest 7 RealTime/IntraDay
- VectorVest AutoTester
- VectorVest Educational Services
- VectorVest OnLine
- VectorVest Options Analyzer
- VectorVest ProGraphics v6.0
- VectorVest ProTrader 7
- VectorVest RealTime Derby Tool
- VectorVest Simulator
- VectorVest Variator
- VectorVest Watchdog
