HOT TOPICS LIST
- MACD
- Fibonacci
- RSI
- Gann
- ADXR
- Stochastics
- Volume
- Triangles
- Futures
- Cycles
- Volatility
- ZIGZAG
- MESA
- Retracement
- Aroon
INDICATORS LIST
LIST OF TOPICS
PRINT THIS ARTICLE
by Matt Blackman
The March 24 rally made history. But does it or others like it, mean the worst is over?
Position: N/A
Matt Blackman
Matt Blackman is a full-time technical and financial writer and trader. He produces corporate and financial newsletters, and assists clients in getting published in the mainstream media. Matt has earned the Chartered Market Technician (CMT) designation. Follow Matt on Twitter at www.twitter.com/RatioTrade
PRINT THIS ARTICLE
BULL/BEAR MARKET
What's Up With These Big Rallies?
03/27/20 04:31:47 PMby Matt Blackman
The March 24 rally made history. But does it or others like it, mean the worst is over?
Position: N/A
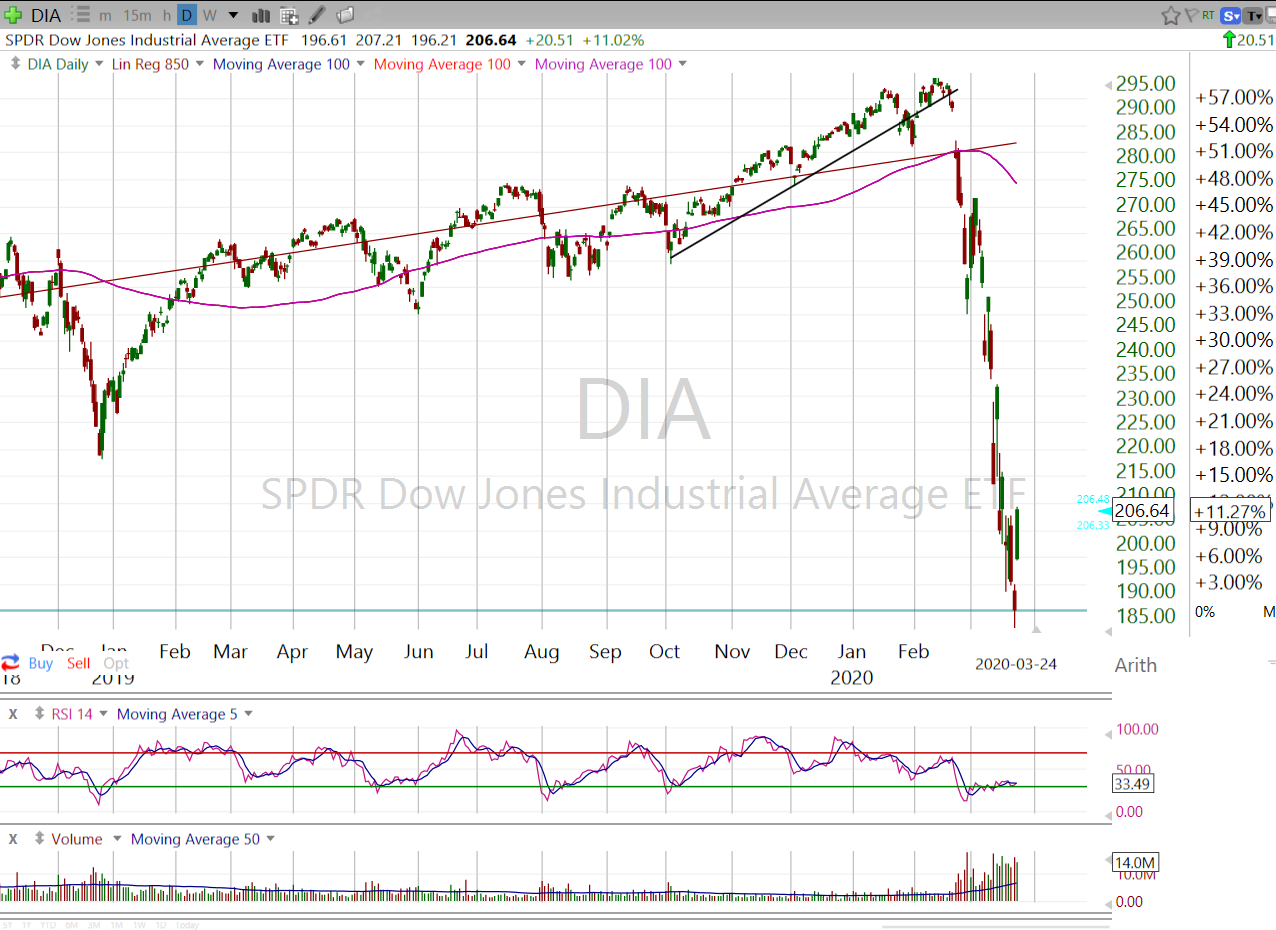
| Covid-19 continued to make itself felt as spring 2020 turned the corner and the stock markets remained caught in the cross-hairs. But on March 24, 2020, the Dow soared more than 11% in one of the biggest single-day rallies in history. It was actually the fourth largest since the 1920s. But does it mean that happy days are here again? Not so fast. |

|
| Figure 1. Daily chart of the SPDR Dow Jones Industrial Average ETF (DIA) showing how it's performed since December 2018 together with the long-term linear regression trend line in red. |
| Graphic provided by: Freestockcharts.com. |
| |
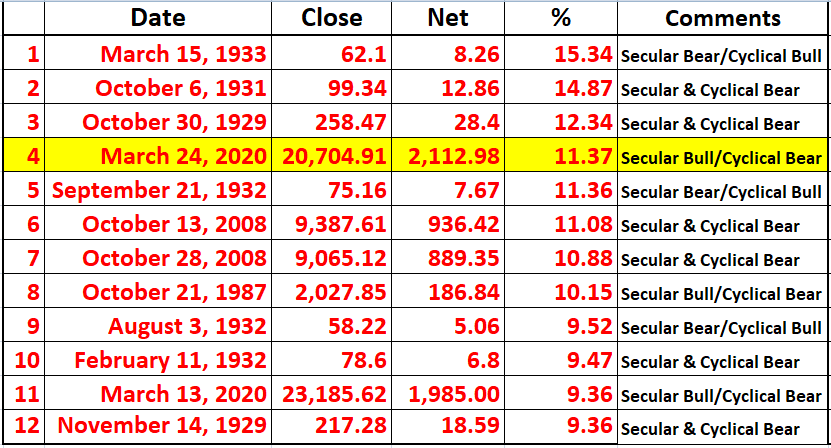
| Until this rally, the Dow had dropped more than 36% from it's February 12 peak, which makes this a bear market. At this point it's a cyclical or short-term (as opposed to a secular) bear, but a bear none-the-less. Basically, a cyclical market lasts from days to months. Secular markets are the primary trend and last for years to decades. So what's the problem? As we see in the next table showing the 12 biggest one-day Dow rallies, all with the exception of two in March 2020 and one in October 1987, occurred during secular bear markets. Perhaps one day we will look back and see March 2020 as the beginning of a secular bear but we will only know in retrospect. But each of the biggest single-day rallies in history occurred in one type of bear market or another. |

|
| Figure 2. List of 12 largest one-day rallies on the Dow Jones Industrial Average. |
| Graphic provided by: Data - Wikipedia.org. |
| |
| So why are one-day bear rallies so much more powerful than their bull counterparts? There are a number of reasons. First, and especially in the early stages of a bear, the bulls are chomping at the bit to jump back in to take advantage of what at this stages looks like a temporary correction. Second, short-sellers who have been making money hand over fist rush to cover their short positions when the rally hits to protect profits. They are called short-covering or short-squeeze rallies for good reason. |

|
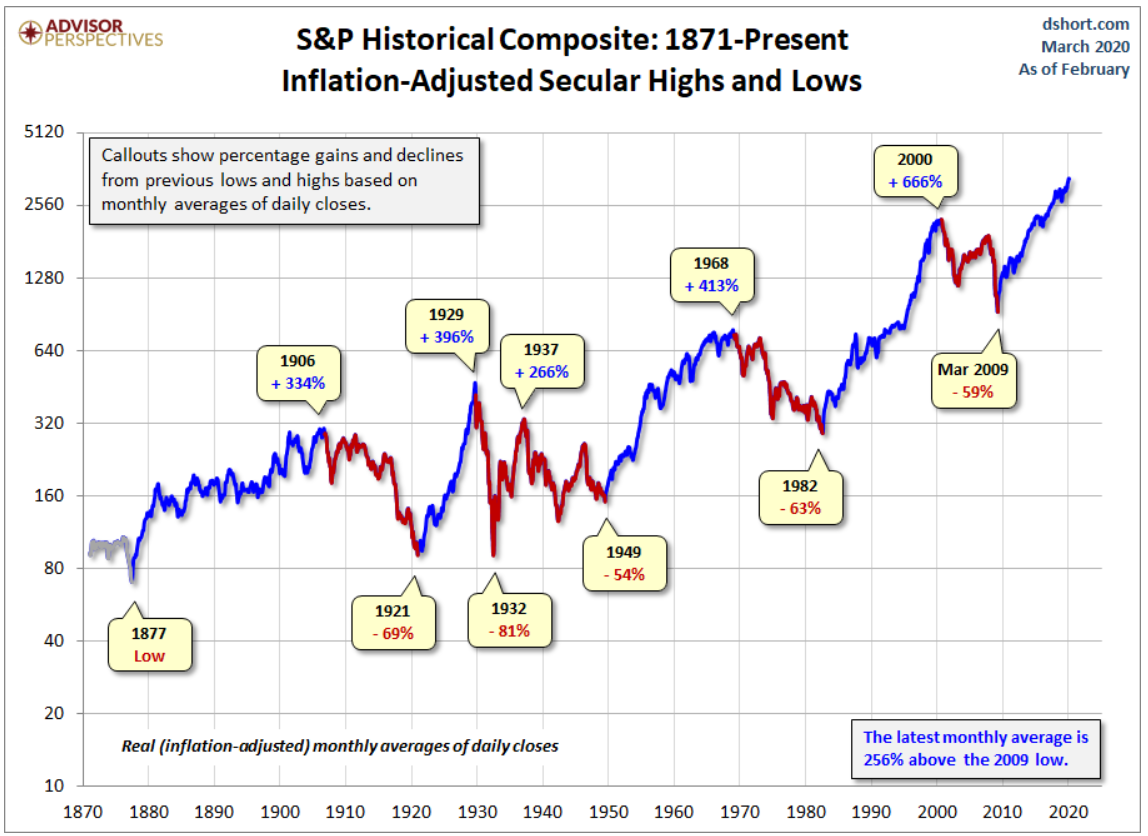
| Figure 3. Chart of the S&P500 showing secular bear markets, which can only be recognized in retrospect, in red. |
| Graphic provided by: Advisorperspectives.com. |
| |
| The practice of jumping in to buy after a large drop has a name — trying to catch a falling knife — and history is replete with traders who have lost their collective shirts doing it. The other problem is that there is often a major battle between the nearly encouraged bears and Johnny Come Lately bulls in the following days so volatility often rises. Like trying to capture the very bottom or top of a market, trying to capture every big up or down move is virtually impossible. Far better to use your technical skills to recognize a bottom being put in, a confirmed low then a series of higher lows and higher highs in a confirmed uptrend, before getting too heavily committed. How long this trend has to be depends on your trading account size and financial pain tolerance. |
Matt Blackman is a full-time technical and financial writer and trader. He produces corporate and financial newsletters, and assists clients in getting published in the mainstream media. Matt has earned the Chartered Market Technician (CMT) designation. Follow Matt on Twitter at www.twitter.com/RatioTrade
| Title: | Author |
| Company: | TradeSystemGuru |
| Address: | Box 2589 |
| Garibaldi Highlands, BC V0N1T0 | |
| Phone # for sales: | 6048989069 |
| E-mail address: | indextradermb@gmail.com |
Traders' Resource Links | |
| TradeSystemGuru has not added any product or service information to TRADERS' RESOURCE. | |
Click here for more information about our publications!
PRINT THIS ARTICLE

Request Information From Our Sponsors
- StockCharts.com, Inc.
- Candle Patterns
- Candlestick Charting Explained
- Intermarket Technical Analysis
- John Murphy on Chart Analysis
- John Murphy's Chart Pattern Recognition
- John Murphy's Market Message
- MurphyExplainsMarketAnalysis-Intermarket Analysis
- MurphyExplainsMarketAnalysis-Visual Analysis
- StockCharts.com
- Technical Analysis of the Financial Markets
- The Visual Investor
- VectorVest, Inc.
- Executive Premier Workshop
- One-Day Options Course
- OptionsPro
- Retirement Income Workshop
- Sure-Fire Trading Systems (VectorVest, Inc.)
- Trading as a Business Workshop
- VectorVest 7 EOD
- VectorVest 7 RealTime/IntraDay
- VectorVest AutoTester
- VectorVest Educational Services
- VectorVest OnLine
- VectorVest Options Analyzer
- VectorVest ProGraphics v6.0
- VectorVest ProTrader 7
- VectorVest RealTime Derby Tool
- VectorVest Simulator
- VectorVest Variator
- VectorVest Watchdog
