HOT TOPICS LIST
- MACD
- Fibonacci
- RSI
- Gann
- ADXR
- Stochastics
- Volume
- Triangles
- Futures
- Cycles
- Volatility
- ZIGZAG
- MESA
- Retracement
- Aroon
INDICATORS LIST
LIST OF TOPICS
PRINT THIS ARTICLE
by Gary Grosschadl
As previously discussed, gold did run up to test the $350 zone. If this area holds, I see $420 potential.
Position: N/A
Gary Grosschadl
Independent Canadian equities trader and technical analyst based in Peterborough
Ontario, Canada.
PRINT THIS ARTICLE
ANDREWS PITCH-FORK
Can Gold Make Upside Target $420?
01/02/03 09:12:55 AMby Gary Grosschadl
As previously discussed, gold did run up to test the $350 zone. If this area holds, I see $420 potential.
Position: N/A
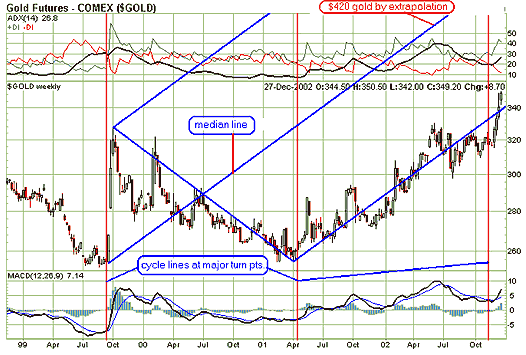
| The Andrews Pitchfork charting tool, sometimes called the Andrews Line or Median Line has been around for some time but is not often used. Now that there is so much charting software available, it may become more common. No need to draw the lines by hand anymore-- let your computer do it. This method employs three points. First, a line is drawn between a significant high and a significant low. This line is bisected, and the median of this line forms a base point for the second line, known as the median line. You then identify the second base point for the median line at any point preceding the significant high and significant low that form the first line. The pitchfork is drawn by inserting two trendlines, one from the significant high, the other from the significant low, parallel to the median line. The resulting formation creates channels. The parallel lines define the resistance and support levels for the price channel. The theory of interpretation has price action tending to follow along one of the fork tines or lines with a move to the median line 80% of the time. A very strong trend can result in a further move to the outside line, otherwise price action may stall and reverse. |
| Normal rules of support and resistance apply. Choosing the correct pivot points can be a bit of an art but aim to choose three significant high and low points and then see if the pattern makes sense. As with other tools, it is not meant to be a standalone magic bullet, but nevertheless with practice you may come up with another valuable trading tool. |

|
| Graphic provided by: StockCharts.com. |
| |
| Figure 1 shows the pitchfork method, along with some cycle lines, applied to the weekly gold chart. These equidistant lines drawn from major turning points reflected on the MACD indicator suggested another major move coming near the $320 level. Somtimes it pays to see if there is a time relationship and in this case there certainly was as gold soon took off from that resting area. Should this bullish action be maintained, the chart suggests a move to the median line. If that is the case, by extrapolation this median line lies around the $420 area-- A worthy upside target. It is unlikely to go up in a straight line so this will test the patience of traders. A major reversal along the way may kill the golden goose so traders should have a gameplan should this move fall short of this bolder upside target. By checking previous reversals along this upward path, we are reminded that this is a volatile commodity and we are still trading in volatile times. Prudent traders should have a game plan in mind and then execute calmly. |
Independent Canadian equities trader and technical analyst based in Peterborough
Ontario, Canada.
| Website: | www.whatsonsale.ca/financial.html |
| E-mail address: | gwg7@sympatico.ca |
Click here for more information about our publications!
PRINT THIS ARTICLE

Request Information From Our Sponsors
- StockCharts.com, Inc.
- Candle Patterns
- Candlestick Charting Explained
- Intermarket Technical Analysis
- John Murphy on Chart Analysis
- John Murphy's Chart Pattern Recognition
- John Murphy's Market Message
- MurphyExplainsMarketAnalysis-Intermarket Analysis
- MurphyExplainsMarketAnalysis-Visual Analysis
- StockCharts.com
- Technical Analysis of the Financial Markets
- The Visual Investor
- VectorVest, Inc.
- Executive Premier Workshop
- One-Day Options Course
- OptionsPro
- Retirement Income Workshop
- Sure-Fire Trading Systems (VectorVest, Inc.)
- Trading as a Business Workshop
- VectorVest 7 EOD
- VectorVest 7 RealTime/IntraDay
- VectorVest AutoTester
- VectorVest Educational Services
- VectorVest OnLine
- VectorVest Options Analyzer
- VectorVest ProGraphics v6.0
- VectorVest ProTrader 7
- VectorVest RealTime Derby Tool
- VectorVest Simulator
- VectorVest Variator
- VectorVest Watchdog
