

HOT TOPICS LIST
- MACD
- Fibonacci
- RSI
- Gann
- ADXR
- Stochastics
- Volume
- Triangles
- Futures
- Cycles
- Volatility
- ZIGZAG
- MESA
- Retracement
- Aroon
INDICATORS LIST
LIST OF TOPICS
PRINT THIS ARTICLE
by Stella Osoba, CMT
The week of February 24, 2020 will go down in history as one of the most volatile in the stock market's history. The S&P 500 fell almost 400 points to close below 3,000 for the first time since October 2019. Further declines look inevitable. Wall Street's "Fear Index", the VIX, closed at 40. Now would seem to be a good time to take a closer look at this popular measure of market volatility.
Position: N/A
Stella Osoba, CMT
Stella Osoba is a trader and financial writer. She is a frequent contributor to "Technical Analysis of Stocks and Commodities" magazine and "Traders.com Advantage" as well as other financial publications.
PRINT THIS ARTICLE
TECHNICAL ANALYSIS
When Fear Breaks Out!
04/09/20 01:33:04 PMby Stella Osoba, CMT
The week of February 24, 2020 will go down in history as one of the most volatile in the stock market's history. The S&P 500 fell almost 400 points to close below 3,000 for the first time since October 2019. Further declines look inevitable. Wall Street's "Fear Index", the VIX, closed at 40. Now would seem to be a good time to take a closer look at this popular measure of market volatility.
Position: N/A
| The CBOE Volatility Index (VIX) is a measure of market volatility based on the S&P 500 Index. It estimates expected volatility by "aggregating the weighted prices of SPX puts and calls over a wide range of strike prices." Wall Street's market participants use the VIX as a short form for interpretation of market volatility. So understanding how these levels apply is useful in successful application of the VIX Index. |
| Important VIX Levels When the VIX is below 12, volatility is generally considered to be low. On the other hand, when the level is above 20, volatility is considered to be high. Normal is anything in between. These levels are not absolute and can be adjusted depending on market conditions, but the levels mentioned can act as a useful guide in interpreting the VIX. |
| What Exactly is Volatility? Volatility is a word which is bandied around in trading circles, so it sometimes is useful to take a step back and remember exactly what the volatility is that the VIX is measuring. The speed of change in price is what volatility is. How fast prices of the Index or a stock is moving. There are two main types of volatility and these are used most often in options pricing. They are historical volatility and implied volatility. Historical volatility is the speed of price movement in the past. Implied volatility is how much traders expect the future speed of price movement to be. The VIX index measures the implied volatility of the options on the S&P 500. Another thing to bear in mind when studying the index is that the VIX is negatively correlated to the stock market. Correlation refers to the relationship between two things. In the stock market, it can refer to the relationship between two stocks, sectors or other asset classes like commodities, bonds etc. Negative correlation means that when the VIX rises, stocks are falling and vice versa. |
| Figure 1 is a chart of the VIX index (black line). Superimposed over it is a line chart of the S&P 500. The purple arrows on the chart show spikes in the VIX. The red arrows below show the corresponding behavior of the S&P 500 index during periods of extreme market volatility. Spikes in the VIX show corresponding declines in the S&P 500. |
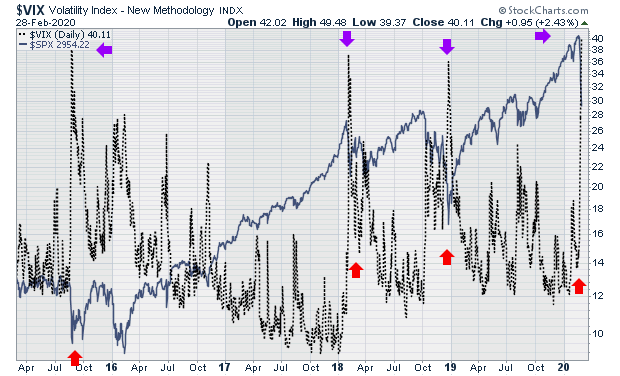
|
| Figure 1. VIX vs. SPX. |
| Graphic provided by: StockCharts.com. |
| |
| Mean Reverting I have found that spikes in the VIX usually confirm what is happening in the S&P 500. The VIX Index is considered to be mean-reverting because periods of high volatility usually revert to periods of lower volatility and vice versa, as the chart clearly shows. This article is too short to do justice to a comprehensive discussion of the VIX. I recommend those wishing to get a fuller understanding of the VIX to click on the links embedded in this article which provide further useful studies of this volatility index. Suggested Reading https://us.spindices.com/education-a-practitioners-guide-to-reading-vix.pdf https://www.cboe.com/micro/vix/vixwhite.pdf |
Stella Osoba is a trader and financial writer. She is a frequent contributor to "Technical Analysis of Stocks and Commodities" magazine and "Traders.com Advantage" as well as other financial publications.
| E-mail address: | stellaosoba@gmail.com |
Click here for more information about our publications!
Comments
Date:�04/09/20Rank:�4Comment:�

Request Information From Our Sponsors
- StockCharts.com, Inc.
- Candle Patterns
- Candlestick Charting Explained
- Intermarket Technical Analysis
- John Murphy on Chart Analysis
- John Murphy's Chart Pattern Recognition
- John Murphy's Market Message
- MurphyExplainsMarketAnalysis-Intermarket Analysis
- MurphyExplainsMarketAnalysis-Visual Analysis
- StockCharts.com
- Technical Analysis of the Financial Markets
- The Visual Investor
- VectorVest, Inc.
- Executive Premier Workshop
- One-Day Options Course
- OptionsPro
- Retirement Income Workshop
- Sure-Fire Trading Systems (VectorVest, Inc.)
- Trading as a Business Workshop
- VectorVest 7 EOD
- VectorVest 7 RealTime/IntraDay
- VectorVest AutoTester
- VectorVest Educational Services
- VectorVest OnLine
- VectorVest Options Analyzer
- VectorVest ProGraphics v6.0
- VectorVest ProTrader 7
- VectorVest RealTime Derby Tool
- VectorVest Simulator
- VectorVest Variator
- VectorVest Watchdog