

HOT TOPICS LIST
- MACD
- Fibonacci
- RSI
- Gann
- ADXR
- Stochastics
- Volume
- Triangles
- Futures
- Cycles
- Volatility
- ZIGZAG
- MESA
- Retracement
- Aroon
INDICATORS LIST
LIST OF TOPICS
PRINT THIS ARTICLE
by Stella Osoba, CMT
Point and Figure (P&F) charting is perhaps the oldest method of price charting in the Western world. But they are often overlooked because they are perceived as complex and archaic. I have found that getting familiar with P&F charts can add value to your analysis. In this article we will look at Bull Traps, what they mean and the best way to trade them.
Position: N/A
Stella Osoba, CMT
Stella Osoba is a trader and financial writer. She is a frequent contributor to "Technical Analysis of Stocks and Commodities" magazine and "Traders.com Advantage" as well as other financial publications.
PRINT THIS ARTICLE
TECHNICAL ANALYSIS
Trading Bull Traps
03/05/20 04:14:36 PMby Stella Osoba, CMT
Point and Figure (P&F) charting is perhaps the oldest method of price charting in the Western world. But they are often overlooked because they are perceived as complex and archaic. I have found that getting familiar with P&F charts can add value to your analysis. In this article we will look at Bull Traps, what they mean and the best way to trade them.
Position: N/A
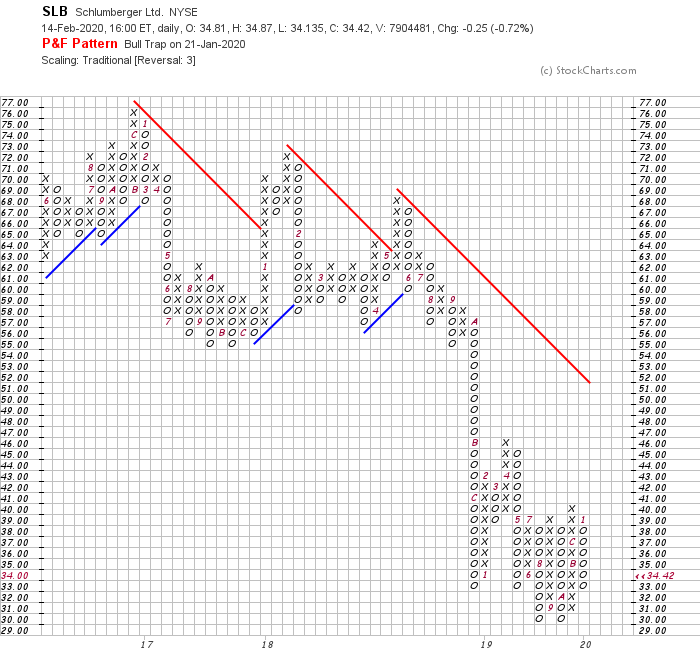
| Schlumberger Limited (SLB) is a large cap, international oilfield services company. It recently formed a Bull Trap on the 3-box reversal P&F charts, see Figure 1. Bull Traps occur when a multiple buy signal reverses back into the pattern after exceeding the prior high by one box. In Figure 1, we can see that a bullish breakout signal occurred in the last column of Xs. Then price reversed back into the pattern and a series of Os formed the Bull Trap. |
|
| Figure 1. Point and Figure chart for SLB. |
| Graphic provided by: StockCharts.com. |
| |
| Bull Traps are not easy to trade because it is only with the benefit of hindsight that we can know if a sell signal will occur, at which point the previous buy signal will be negated. Therefore, if you are long the position, you should remain long and not pre-empt the signal by exiting and shorting the trade. It is very important to bear in mind that a bull trap can be part of one of the strongest signals you can get in P&F charts. |
| The Catapult When price breaks out of a multiple top pattern by at least one box, but then instead of continuing reverses back into the pattern, then reverses again and breaks out in the prior direction, this in P&F is called a catapult. A catapult is regarded as a strong signal because it shows the determination of the winning side to enter the trade. In our example of bull traps turning into catapults, it shows the bulls taking control of price and overcoming the bears. The bears take the opportunity of rising prices to sell and this causes the price to fall. But the bulls are not done, so eager are they to get into the position and take advantage of the lower prices that their demand overcomes the selling of the bears and forces price back up to new highs. |
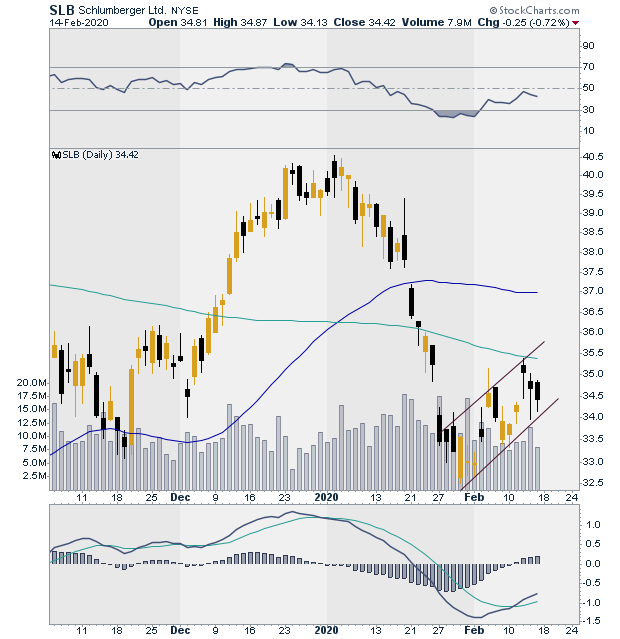
| This is why it is important to hold your horses when you see a bull trap forming. Until the sell signal has formed, it is usually best to wait and watch. The daily candlestick chart of SLB can give us more information about this stock and where its price is likely to go next (See Figure 2). There are signals on this chart that can be interpreted as bullish. Firstly, the 50-day moving average is trading above the 200-day moving average (note that the 50-day MA is flattening and may be a cause for concern, so we should pay careful attention to what it will do next). Price has formed a bullish upward sloping channel and is trading within the channel. The MACD has turned up and the MACD line has crossed above the signal line from below. Two of the last three candles on the chart, though bearish, have formed long lower tails which implies buying demand. |
|
| Figure 2. Daily chart for SLB. |
| Graphic provided by: StockCharts.com. |
| |
| The signals on our chart are overwhelmingly bullish, but until there is price confirmation which would be a bullish breakout of the upper channel line and the formation of a catapult on the P&F chart, SLD should be traded in a holding pattern if we are currently long. Our aim must always be to let the market show us what it will do rather than anticipate what it could do. |
Stella Osoba is a trader and financial writer. She is a frequent contributor to "Technical Analysis of Stocks and Commodities" magazine and "Traders.com Advantage" as well as other financial publications.
| E-mail address: | stellaosoba@gmail.com |
Click here for more information about our publications!
PRINT THIS ARTICLE

Request Information From Our Sponsors
- StockCharts.com, Inc.
- Candle Patterns
- Candlestick Charting Explained
- Intermarket Technical Analysis
- John Murphy on Chart Analysis
- John Murphy's Chart Pattern Recognition
- John Murphy's Market Message
- MurphyExplainsMarketAnalysis-Intermarket Analysis
- MurphyExplainsMarketAnalysis-Visual Analysis
- StockCharts.com
- Technical Analysis of the Financial Markets
- The Visual Investor
- VectorVest, Inc.
- Executive Premier Workshop
- One-Day Options Course
- OptionsPro
- Retirement Income Workshop
- Sure-Fire Trading Systems (VectorVest, Inc.)
- Trading as a Business Workshop
- VectorVest 7 EOD
- VectorVest 7 RealTime/IntraDay
- VectorVest AutoTester
- VectorVest Educational Services
- VectorVest OnLine
- VectorVest Options Analyzer
- VectorVest ProGraphics v6.0
- VectorVest ProTrader 7
- VectorVest RealTime Derby Tool
- VectorVest Simulator
- VectorVest Variator
- VectorVest Watchdog