HOT TOPICS LIST
- MACD
- Fibonacci
- RSI
- Gann
- ADXR
- Stochastics
- Volume
- Triangles
- Futures
- Cycles
- Volatility
- ZIGZAG
- MESA
- Retracement
- Aroon
INDICATORS LIST
LIST OF TOPICS
PRINT THIS ARTICLE
by Kevin Hopson
The chart for Frontier Oil is painting two different pictures. Though some of the technicals are indicating significant resistance at current levels, others are projecting higher prices.
Position: Hold
Kevin Hopson
Kevin has been a technical analyst for roughly 10 years now. Previously, Kevin owned his own business and acted as a registered investment advisor, specializing in energy. He was also a freelance oil analyst for Orient Trading Co., a commodity futures trading firm in Japan. Kevin is currently a freelance writer.
PRINT THIS ARTICLE
PIVOT POINT REVERSE
Frontier Oil is at a Key Juncture Right Now
12/30/02 02:34:56 PMby Kevin Hopson
The chart for Frontier Oil is painting two different pictures. Though some of the technicals are indicating significant resistance at current levels, others are projecting higher prices.
Position: Hold
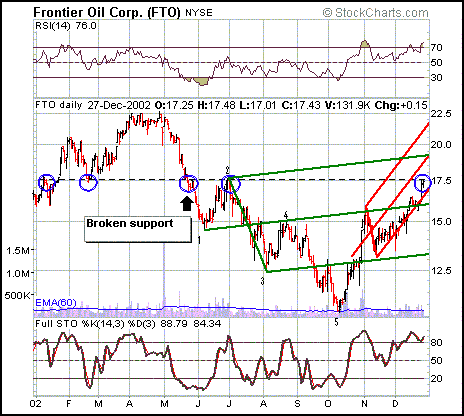
| Frontier Oil (FTO), a small oil refinery with operations in Wyoming and Kansas, completed a five-month downtrend back in October and now looks to be in the second leg up (Elliott wave "third wave") of its current uptrend. I am not an Elliott wave expert but I do use Andrew's pitchforks and median lines to predict significant turning points (cycle reversals) in stocks and commodities. These technical indicators utilize the basic theory of Elliott Wave analysis, in that uptrends and downtrends usually occur in five major waves. |
| The numbers in the chart indicate each significant pivot point (or the end of each wave) in the order that they occurred. Though they are not included in the chart, pitchforks and median lines accurately predicted the completion of the third and fifth waves. Just to provide an example, however, I drew a pitchfork using the first, second and third pivot points. This type of pitchfork is used to predict the completion point of the second leg up (fourth wave) in a downtrend. Completion of the fourth wave is supposed to occur when the stock price hits the median line of this pitchfork. As you can see, completion of the fourth wave occurred right at the green median line, making this tool invaluable. There are additional pitchfork/median line techniques that can be used when this primary method fails but they are beyond the scope of this article. My purpose is to help you better understand the chart. |

|
| Graphic provided by: StockCharts.com. |
| |
| Now that we have the basics out of the way, let us take a closer look at Frontier's chart. Note the stock's resistance at the $17.50 level. As you can see, Frontier Oil broke resistance at the $17.50 level back in January, which then acted as support for the stock in February. However, Frontier eventually broke support here in May and has been unable to move above this level since then. More specifically, the stock has formed a spread double top here, which is indicated by the last two blue circles in the chart. Coupled with a decent amount of call open interest at the $17.50 level, Frontier could find significant resistance here. |
| However, the pitchforks indicate a potential move higher before a more substantial pullback occurs. For example, Frontier recently moved above the green median line, which had acted as resistance since late July. The recent breakout was likely spurred by significant open interest in the January 2003 $15.00 call options. In other words, sellers of these contracts were probably forced to reverse their positions (buy the stock) once Frontier started to move against them - or "in-the-money". |
| In any event, the red pitchfork projects the possible completion point of the current leg up. Since a touch of the red median line is necessary for this to occur, the pitchfork is projecting higher prices. More specifically, the red median line and the top green parallel line both intersect at higher prices, indicating a potential upside target of roughly $19.00 or so. This is based on the current chart, meaning that the price target will likely move higher as time goes on (because these lines will continue to extend). With the chart telling two different stories, I would keep a close eye on the stock. For example, if Frontier can substantially clear the $17.50 level (hit $18.00), look for higher prices to prevail in the near-term. Otherwise, look for significant support down around the $16.00 level, site of the stock's 200-day moving average and the green median line. |
Kevin has been a technical analyst for roughly 10 years now. Previously, Kevin owned his own business and acted as a registered investment advisor, specializing in energy. He was also a freelance oil analyst for Orient Trading Co., a commodity futures trading firm in Japan. Kevin is currently a freelance writer.
| Glen Allen, VA | |
| E-mail address: | hopson_1@yahoo.com |
Click here for more information about our publications!
PRINT THIS ARTICLE

Request Information From Our Sponsors
- StockCharts.com, Inc.
- Candle Patterns
- Candlestick Charting Explained
- Intermarket Technical Analysis
- John Murphy on Chart Analysis
- John Murphy's Chart Pattern Recognition
- John Murphy's Market Message
- MurphyExplainsMarketAnalysis-Intermarket Analysis
- MurphyExplainsMarketAnalysis-Visual Analysis
- StockCharts.com
- Technical Analysis of the Financial Markets
- The Visual Investor
- VectorVest, Inc.
- Executive Premier Workshop
- One-Day Options Course
- OptionsPro
- Retirement Income Workshop
- Sure-Fire Trading Systems (VectorVest, Inc.)
- Trading as a Business Workshop
- VectorVest 7 EOD
- VectorVest 7 RealTime/IntraDay
- VectorVest AutoTester
- VectorVest Educational Services
- VectorVest OnLine
- VectorVest Options Analyzer
- VectorVest ProGraphics v6.0
- VectorVest ProTrader 7
- VectorVest RealTime Derby Tool
- VectorVest Simulator
- VectorVest Variator
- VectorVest Watchdog
