

HOT TOPICS LIST
- MACD
- Fibonacci
- RSI
- Gann
- ADXR
- Stochastics
- Volume
- Triangles
- Futures
- Cycles
- Volatility
- ZIGZAG
- MESA
- Retracement
- Aroon
INDICATORS LIST
LIST OF TOPICS
PRINT THIS ARTICLE
by Stella Osoba, CMT
For the last year cannabis stocks can't seem to do anything right. They have mostly been on a decline with some stocks losing 50% and more of their valuations from their 2018 peaks. This article will take a look at one such stock, Canopy Growth Corp. (CGC).
Position: N/A
Stella Osoba, CMT
Stella Osoba is a trader and financial writer. She is a frequent contributor to "Technical Analysis of Stocks and Commodities" magazine and "Traders.com Advantage" as well as other financial publications.
PRINT THIS ARTICLE
TECHNICAL ANALYSIS
What's The Problem With Cannabis Stocks?
02/27/20 03:39:57 PMby Stella Osoba, CMT
For the last year cannabis stocks can't seem to do anything right. They have mostly been on a decline with some stocks losing 50% and more of their valuations from their 2018 peaks. This article will take a look at one such stock, Canopy Growth Corp. (CGC).
Position: N/A
| CGC is a Canadian based cannabis company. Despite a $3.8 billion investment from Constellation Brands (STX) in August 2018, CGC has declined from a high of $59.25 reached in October 2018 to around $23 in February 2020. It has recently gotten a bounce from a better than expected fourth quarter earnings loss of $0.27 per share. The news sent the share soaring, gapping up to create an island reversal as we will see in Figure 2. |
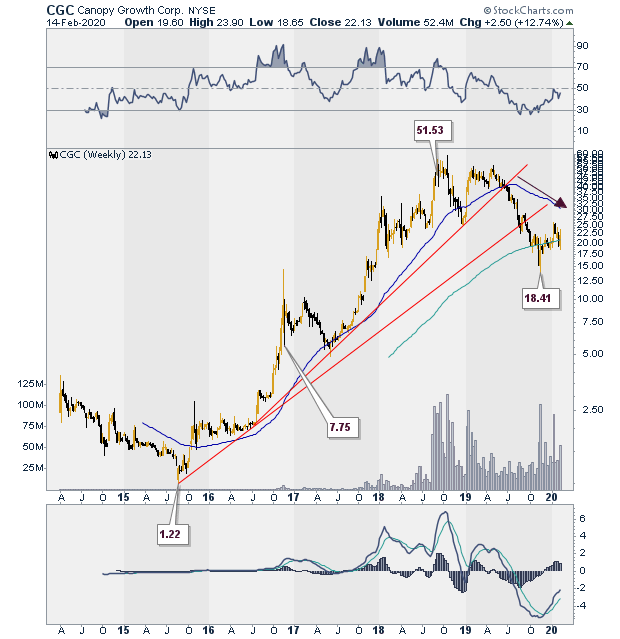
| Figure 1 is a longer term weekly chart showing the prior trend of CGC. From 2015 until 2018, CGC was in a strong uptrend, with price rising from a low of $1.22 in mid-2015 to a closing high of $51.53 in the second half of 2018. Then, it seemed the stock could do no wrong. People rushed to get onboard the expected cannabis industry explosion. There was news of the expected worldwide legalization of cannabis, losses were not a concern. The chart showed a successful test of the uptrend line in December 2018. But the next leg-up revealed signs of trouble. Price formed a lower high. Sideways trading then continued for the next six months before price declined and sliced through the uptrend line, bringing the uptrend to a halt. |
|
| Figure 1. Weekly chart for CGC. |
| Graphic provided by: StockCharts.com. |
| |
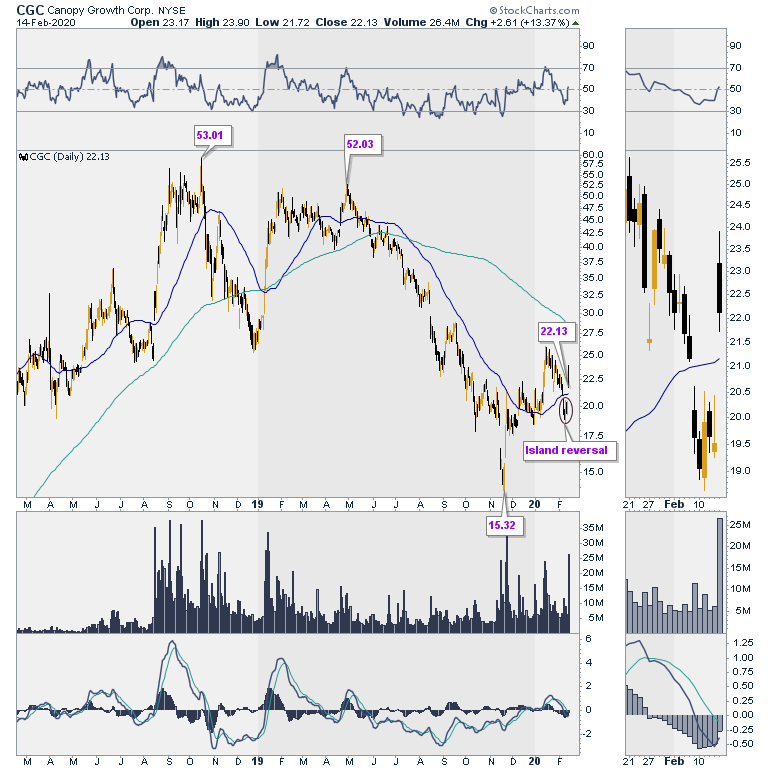
| The subsequent decline took price to a closing low of $15.32 in November 2019 when price traded well below both the 50- and 200-day moving averages. Figure 2 is a daily chart of CGC, showing the price decline and subsequent tepid recovery when price moved up above the 50-day moving average on decent volume and found support there for a time. The next leg-up could not be sustained and price came crashing down, slicing back through the 50-day moving average as it gapped down (see thumb nail in Figure 2). For five days, CGC traded below its 50-day moving average forming candles with bearish long upper tails. Then news of the earnings surprise hit and price gapped up above the 50-day moving average on heavy volume. |
|
| Figure 2. Daily chart for CGC. |
| Graphic provided by: StockCharts.com. |
| |
| Does this is mean the downtrend is over? Not necessarily. The candle formed on the day news of the earnings surprise was announced is bearish, closing near its price low. But the island reversal is a bullish signal. The whole area of the gap up becomes support. If price can stay above support that is positive. Wait for the test of support and see how price performs. Strong support at the levels of the gap up will likely spell good news for the future of the stock. |
Stella Osoba is a trader and financial writer. She is a frequent contributor to "Technical Analysis of Stocks and Commodities" magazine and "Traders.com Advantage" as well as other financial publications.
| E-mail address: | stellaosoba@gmail.com |
Click here for more information about our publications!
PRINT THIS ARTICLE

Request Information From Our Sponsors
- VectorVest, Inc.
- Executive Premier Workshop
- One-Day Options Course
- OptionsPro
- Retirement Income Workshop
- Sure-Fire Trading Systems (VectorVest, Inc.)
- Trading as a Business Workshop
- VectorVest 7 EOD
- VectorVest 7 RealTime/IntraDay
- VectorVest AutoTester
- VectorVest Educational Services
- VectorVest OnLine
- VectorVest Options Analyzer
- VectorVest ProGraphics v6.0
- VectorVest ProTrader 7
- VectorVest RealTime Derby Tool
- VectorVest Simulator
- VectorVest Variator
- VectorVest Watchdog
- StockCharts.com, Inc.
- Candle Patterns
- Candlestick Charting Explained
- Intermarket Technical Analysis
- John Murphy on Chart Analysis
- John Murphy's Chart Pattern Recognition
- John Murphy's Market Message
- MurphyExplainsMarketAnalysis-Intermarket Analysis
- MurphyExplainsMarketAnalysis-Visual Analysis
- StockCharts.com
- Technical Analysis of the Financial Markets
- The Visual Investor