

HOT TOPICS LIST
- MACD
- Fibonacci
- RSI
- Gann
- ADXR
- Stochastics
- Volume
- Triangles
- Futures
- Cycles
- Volatility
- ZIGZAG
- MESA
- Retracement
- Aroon
INDICATORS LIST
LIST OF TOPICS
PRINT THIS ARTICLE
by Stella Osoba, CMT
Sometimes to improve clarity, it pays to flip a chart upside down and study it that way for a while.
Position: N/A
Stella Osoba, CMT
Stella Osoba is a trader and financial writer. She is a frequent contributor to "Technical Analysis of Stocks and Commodities" magazine and "Traders.com Advantage" as well as other financial publications.
PRINT THIS ARTICLE
TECHNICAL ANALYSIS
Using Upside Down Charts
02/20/20 04:29:41 PMby Stella Osoba, CMT
Sometimes to improve clarity, it pays to flip a chart upside down and study it that way for a while.
Position: N/A
| Boeing (BA), the aerospace firm with a market capitalization of around $180 billion, has been in the news the last couple of years for all the wrong reasons. The two tragic fatal accidents involving the Boeing 737 MAX jets happening within five months of each other resulted in the worst type of publicity for the company. The knock on effects of these tragedies was a grounding of all 737 MAX Boeing aircraft. The company estimates that the ungrounding of the 737 MAX jet will begin mid-2020, pending a successful completion of the certifying process for the 737 MAX software and related training updates laid out by the FAA and other global regulators. |
|
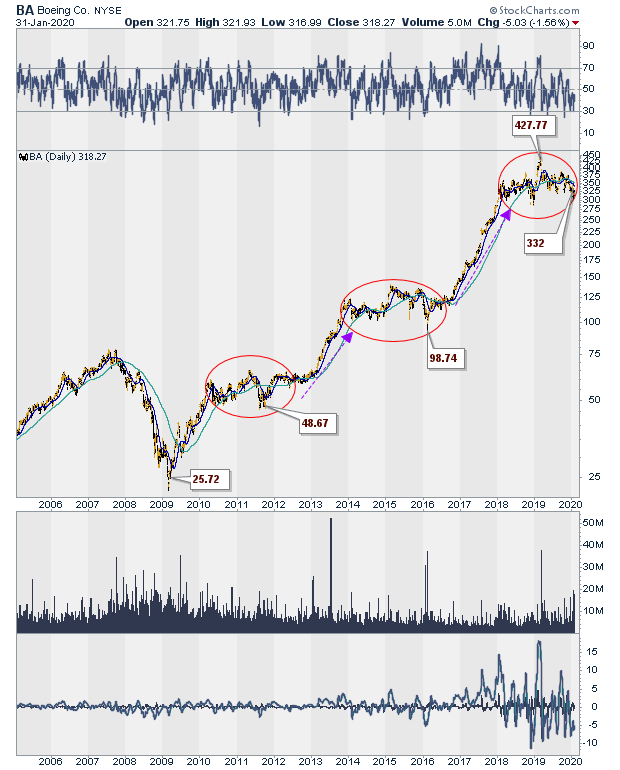
| Figure 1. Daily chart for BA (2005-2020). |
| Graphic provided by: StockCharts.com. |
| |
| Figure 1 is a long term daily chart of BA. It clearly shows BA in a longterm uptrend, with significant periods of consolidation (see red circles on chart) along the way. In fact, it looks like the current period of consolidation stretches from about January 2018 until the present. The first of the two tragic accidents involving the MAX jet, was the Lion Air flight 610 which crashed minutes from taking off from Jakarta, Indonesia on October 28, 2018. The second flight was the Ethiopian Airlines Flight 302 which crashed on March 10, 2019, minutes after take off, tragically killing all on board. |
|
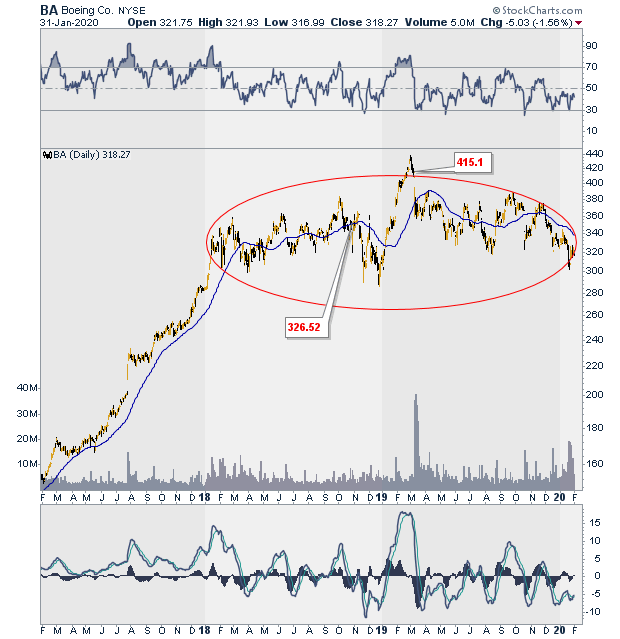
| Figure 2. Daily chart for BA (2017-2020). |
| Graphic provided by: StockCharts.com. |
| |
| October 28, 2018 and March 10, 2019, the dates of the two tragic crashes, was within the consolidation period as we can see in Figure 2. A failed break out of the consolidation area occurred in February and price was declining back into the consolidation area when the second tragedy happened. |
|
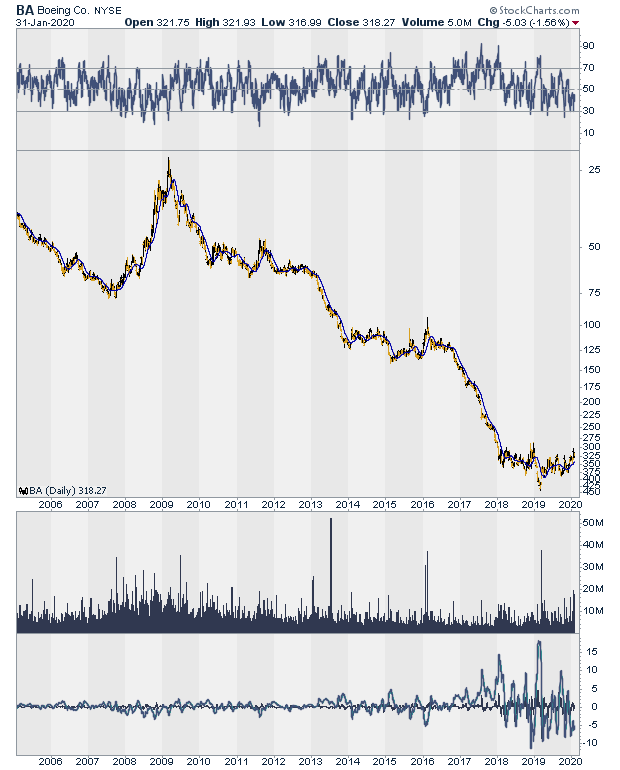
| Figure 3. Daily chart for BA turned upside down. |
| Graphic provided by: StockCharts.com. |
| |
| If we were to ignore the news and study the price chart, where is price more likely to go when it eventually breaks out of its consolidation area? Because it entered the consolidation up, it could reverse to the downside, making the consolidation area a trend reversal, or it could leave the consolidation area as it entered, making the pattern a continuation. Sometime reversing the chart to get a different perspective can be helpful (See Figure 3). In Figure 3, I have turned the chart upside down. The preceding trend is clear and impressive. Where is price likely to go from here? The odds likely favor a continuation with price leaving the trading range area as it entered. |
| But a note of caution — Trading is difficult, because what is likely to happen often does not happen. I could just as easily be wrong. You have to perform your own analysis and decide how you want to trade because as we well know, with trading, anything is possible. Be prepared and buy protection. |
Stella Osoba is a trader and financial writer. She is a frequent contributor to "Technical Analysis of Stocks and Commodities" magazine and "Traders.com Advantage" as well as other financial publications.
| E-mail address: | stellaosoba@gmail.com |
Click here for more information about our publications!
PRINT THIS ARTICLE

Request Information From Our Sponsors
- StockCharts.com, Inc.
- Candle Patterns
- Candlestick Charting Explained
- Intermarket Technical Analysis
- John Murphy on Chart Analysis
- John Murphy's Chart Pattern Recognition
- John Murphy's Market Message
- MurphyExplainsMarketAnalysis-Intermarket Analysis
- MurphyExplainsMarketAnalysis-Visual Analysis
- StockCharts.com
- Technical Analysis of the Financial Markets
- The Visual Investor
- VectorVest, Inc.
- Executive Premier Workshop
- One-Day Options Course
- OptionsPro
- Retirement Income Workshop
- Sure-Fire Trading Systems (VectorVest, Inc.)
- Trading as a Business Workshop
- VectorVest 7 EOD
- VectorVest 7 RealTime/IntraDay
- VectorVest AutoTester
- VectorVest Educational Services
- VectorVest OnLine
- VectorVest Options Analyzer
- VectorVest ProGraphics v6.0
- VectorVest ProTrader 7
- VectorVest RealTime Derby Tool
- VectorVest Simulator
- VectorVest Variator
- VectorVest Watchdog