HOT TOPICS LIST
- MACD
- Fibonacci
- RSI
- Gann
- ADXR
- Stochastics
- Volume
- Triangles
- Futures
- Cycles
- Volatility
- ZIGZAG
- MESA
- Retracement
- Aroon
INDICATORS LIST
LIST OF TOPICS
PRINT THIS ARTICLE
by Gary Grosschadl
Amgen is a global biotech company and chartwise is at a crucial point, which pattern wins?
Position: Hold
Gary Grosschadl
Independent Canadian equities trader and technical analyst based in Peterborough
Ontario, Canada.
PRINT THIS ARTICLE
TRIANGLES
Amgen's Conflicting Patterns
12/31/02 09:48:57 AMby Gary Grosschadl
Amgen is a global biotech company and chartwise is at a crucial point, which pattern wins?
Position: Hold
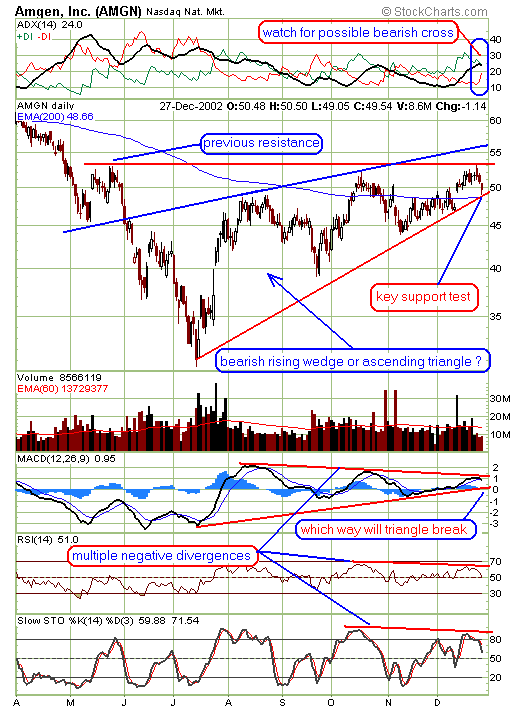
| Reading charts often becomes a challenge when two patterns are present. Amgen makes a good study here. I recall in a previous analysis where I suggested (correctly as it turned out) that the Nasdaq was in a bearish rising wedge pattern and likely to fail. I subsequently received some interesting "fanmail" saying, no it was a bullish ascending triangle, and the e-mailer was very pleased with their long position. The very next day the decline started and the bearish wedge failure came to pass over the next while. The lesson there is to look for an alternate pattern (if one exists) and then wait for some convincing evidence to steer you in the right path. It is hard sometimes to avoid jumping the gun. |
| The chart shows Amgen hitting previous resistance and now is coming off that point which serves to establish the ascending triangle pattern. Before this occurrance, a pattern of a bearish rising wedge is evident. Currently one could make the observation that this latest downturn the past few trading days was foretold by the multiple negative divergences as illustrated on the displayed indicators. Now the stock is at a likely key support test being at the lower trendline and the 200-day EMA. A move below this level on ideally large volume could indicate the rising wedge failure is starting. On the other hand, a bounce here could take Amgen up to challenge the ascending triangle again. Note if this occurs there will be another test of the next trendline being the upper rising wedge trendline. |

|
| Graphic provided by: StockCharts.com. |
| |
| In summary, the jury is still out until we see convincing proof. A sudden move down on convincing volume now would be proof for the bearish wedge outcome (it could also be an ascending triangle failure). A move back up means the pattern is not yet clear and traders should wait more definitive action at those previously discussed points. When the time comes look for multiple confirmations including an obvious candlestick pattern with large volume. The displayed indicators should also be giving some valuable hints as well. No doubt others will also be watching their own pet indicators. The point is to wait for a weight of evidence to tilt the odds in your favor if you are a more prudent trader. In other words do not jump the gun but be patient enough to act on the better pattern signals. |
Independent Canadian equities trader and technical analyst based in Peterborough
Ontario, Canada.
| Website: | www.whatsonsale.ca/financial.html |
| E-mail address: | gwg7@sympatico.ca |
Click here for more information about our publications!
PRINT THIS ARTICLE

Request Information From Our Sponsors
- StockCharts.com, Inc.
- Candle Patterns
- Candlestick Charting Explained
- Intermarket Technical Analysis
- John Murphy on Chart Analysis
- John Murphy's Chart Pattern Recognition
- John Murphy's Market Message
- MurphyExplainsMarketAnalysis-Intermarket Analysis
- MurphyExplainsMarketAnalysis-Visual Analysis
- StockCharts.com
- Technical Analysis of the Financial Markets
- The Visual Investor
- VectorVest, Inc.
- Executive Premier Workshop
- One-Day Options Course
- OptionsPro
- Retirement Income Workshop
- Sure-Fire Trading Systems (VectorVest, Inc.)
- Trading as a Business Workshop
- VectorVest 7 EOD
- VectorVest 7 RealTime/IntraDay
- VectorVest AutoTester
- VectorVest Educational Services
- VectorVest OnLine
- VectorVest Options Analyzer
- VectorVest ProGraphics v6.0
- VectorVest ProTrader 7
- VectorVest RealTime Derby Tool
- VectorVest Simulator
- VectorVest Variator
- VectorVest Watchdog
