

HOT TOPICS LIST
- MACD
- Fibonacci
- RSI
- Gann
- ADXR
- Stochastics
- Volume
- Triangles
- Futures
- Cycles
- Volatility
- ZIGZAG
- MESA
- Retracement
- Aroon
INDICATORS LIST
LIST OF TOPICS
PRINT THIS ARTICLE
by Stella Osoba, CMT
Coronaviruses are a family of viruses that can cause diseases in animals, including humans, and birds. Common human coronaviruses usually cause illnesses like the common cold, which most people would have had at some point in their lives. Sometimes, a strain of the coronavirus will mutate causing more severe symptoms in some people. This happened with the Middle East Respiratory Syndrome-related coronavirus (MERS-CoV) and Severe Acute Respiratory Syndrome (SARS-CoV). Recently, Chinese authorities detected a new outbreak of the coronavirus which has been labelled 2019-nCoV. While this virus is in the same family as the SARS virus, scientists have said it appears to be a new disease. Ground zero appears to be the Chinese city of Wuhan, a sprawling city with a population of about 12 million people. To contain the spread of the virus while the race for a vaccine accelerates, Chinese authorities have shut down transit going into and out of the city.
Position: N/A
Stella Osoba, CMT
Stella Osoba is a trader and financial writer. She is a frequent contributor to "Technical Analysis of Stocks and Commodities" magazine and "Traders.com Advantage" as well as other financial publications.
PRINT THIS ARTICLE
TECHNICAL ANALYSIS
Event Driven Trades
02/13/20 04:00:52 PMby Stella Osoba, CMT
Coronaviruses are a family of viruses that can cause diseases in animals, including humans, and birds. Common human coronaviruses usually cause illnesses like the common cold, which most people would have had at some point in their lives. Sometimes, a strain of the coronavirus will mutate causing more severe symptoms in some people. This happened with the Middle East Respiratory Syndrome-related coronavirus (MERS-CoV) and Severe Acute Respiratory Syndrome (SARS-CoV). Recently, Chinese authorities detected a new outbreak of the coronavirus which has been labelled 2019-nCoV. While this virus is in the same family as the SARS virus, scientists have said it appears to be a new disease. Ground zero appears to be the Chinese city of Wuhan, a sprawling city with a population of about 12 million people. To contain the spread of the virus while the race for a vaccine accelerates, Chinese authorities have shut down transit going into and out of the city.
Position: N/A
| But this has not stopped the virus from spreading out of China with new cases being reported each day outside China. As fears of the virus spreading around the world grows, shares of companies that have announced plans to participate in finding a vaccine have risen sharply in very active trading by those who wish to participate in an event driven trade. So that being the case, let us look at one such company and determine if the outbreak of this virus is reason enough to participate in trading the stock. |
| Inovio Pharmaceuticals Inc. (INO) is a small cap biotechnology company which is involved in developing vaccines focused on treating cancers and infectious diseases. The company announced on January 23, 2020 that it was awarded a grant of up to $9 million by the Coalition for Epidemic Preparedness Innovations (CEPI) to develop a vaccine to treat this new strain of the coronavirus. |
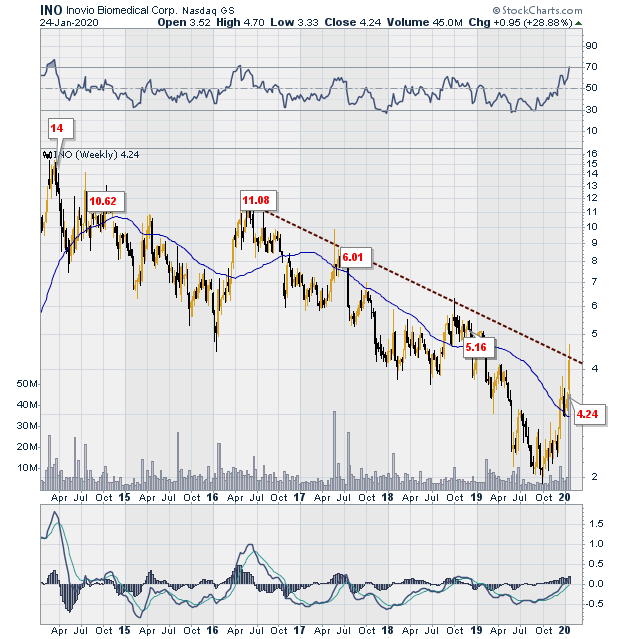
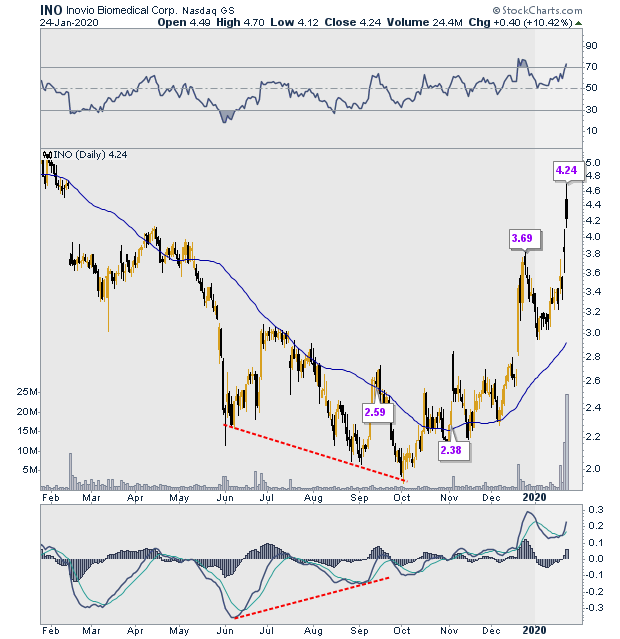
| Figure 1 is a weekly chart of INO which shows the stock in a multi-year downtrend. From a high of about $14 per share reached in March 2014, the stock fell to a low of about $2.00 per share in September 2019. The trend line depicted on the chart clearly shows the trend is down. But had the chart been on your radar, you might have noticed that trend begin to reverse well before the outbreak of the current epidemic. Figure 2 shows that price formed a positive divergence with both the RSI and MACD depicted in the upper and lower panels. This signals a possible trend change. Price proceeded to begin making higher lows and higher highs, confirming the signal from the indicators. |
|
| Figure 1. Weekly chart for INO. |
| Graphic provided by: StockCharts.com. |
| |
| With the World Health Organization not being notified of the first suspected cases of the virus until December 31, 2019, the price trend change had begun in INO months earlier. Volume begins to spike on the chart on January 21, 2020 and continues on January 23 and 24. This coincides with the announcement by INO on January 24 that they had received a grant to develop a vaccine to treat the virus. In fact, the average daily trading volume in the months prior to the outbreak was about 2 million shares. On January 24, 2020, volume spiked to 24.6 million shares. The chart shows that trading on January 24 was very volatile with price opening at $4.49, rising to a high of $4.70 and closing near its low of the day at $4.24. From the looks of the chart, it is not certain that those entering the trade on January 24, will not immediately begin seeing losses in the near term while price reacts to absorb gains. |
|
| Figure 2. Daily chart for INO. |
| Graphic provided by: StockCharts.com. |
| |
| Technical analysis tells us that all the news is in the charts. Once a story hits the news, it often signals that one is late to the party. Therefore it is usually never a good idea to chase the news. Careful analysis of the chart will reveal the story of the move far earlier than news reports will. |
Stella Osoba is a trader and financial writer. She is a frequent contributor to "Technical Analysis of Stocks and Commodities" magazine and "Traders.com Advantage" as well as other financial publications.
| E-mail address: | stellaosoba@gmail.com |
Click here for more information about our publications!
PRINT THIS ARTICLE

Request Information From Our Sponsors
- VectorVest, Inc.
- Executive Premier Workshop
- One-Day Options Course
- OptionsPro
- Retirement Income Workshop
- Sure-Fire Trading Systems (VectorVest, Inc.)
- Trading as a Business Workshop
- VectorVest 7 EOD
- VectorVest 7 RealTime/IntraDay
- VectorVest AutoTester
- VectorVest Educational Services
- VectorVest OnLine
- VectorVest Options Analyzer
- VectorVest ProGraphics v6.0
- VectorVest ProTrader 7
- VectorVest RealTime Derby Tool
- VectorVest Simulator
- VectorVest Variator
- VectorVest Watchdog
- StockCharts.com, Inc.
- Candle Patterns
- Candlestick Charting Explained
- Intermarket Technical Analysis
- John Murphy on Chart Analysis
- John Murphy's Chart Pattern Recognition
- John Murphy's Market Message
- MurphyExplainsMarketAnalysis-Intermarket Analysis
- MurphyExplainsMarketAnalysis-Visual Analysis
- StockCharts.com
- Technical Analysis of the Financial Markets
- The Visual Investor