

HOT TOPICS LIST
- MACD
- Fibonacci
- RSI
- Gann
- ADXR
- Stochastics
- Volume
- Triangles
- Futures
- Cycles
- Volatility
- ZIGZAG
- MESA
- Retracement
- Aroon
INDICATORS LIST
LIST OF TOPICS
PRINT THIS ARTICLE
by Taylor Ireland
In this article, we examine the order flow and market structure data in the WTI futures market that provides insight into initial breakout higher and subsequent price discovery lower for Wednesday, January 8, 2020 as the Iran attack narrative became known. Market structure and order flow provide insight into the actual transactional activity of a dual-auction's price discovery process. Analysis of this data provides real-time insight into the actions of market participants, providing a dynamic dataset to inform one's risk management process.
Position: N/A
Taylor Ireland
Sharedata Futures, Inc. provides historical data mining and visualization for the benchmark NYMEX Energy Futures Markets.
Sharedata combines structural analysis of the market generated data, dynamic systems analysis, and Bayesian causal inference techniques favored by the scientific and intelligence communities to provide a robust framework for addressing the uncertainty and risk in energy pricing.
PRINT THIS ARTICLE
DAY TRADING
WTI Weekly: The Iran Attacks Drive Price Higher, Then Lower As Market Structure And Order Flow Guide
01/30/20 04:01:39 PMby Taylor Ireland
In this article, we examine the order flow and market structure data in the WTI futures market that provides insight into initial breakout higher and subsequent price discovery lower for Wednesday, January 8, 2020 as the Iran attack narrative became known. Market structure and order flow provide insight into the actual transactional activity of a dual-auction's price discovery process. Analysis of this data provides real-time insight into the actions of market participants, providing a dynamic dataset to inform one's risk management process.
Position: N/A
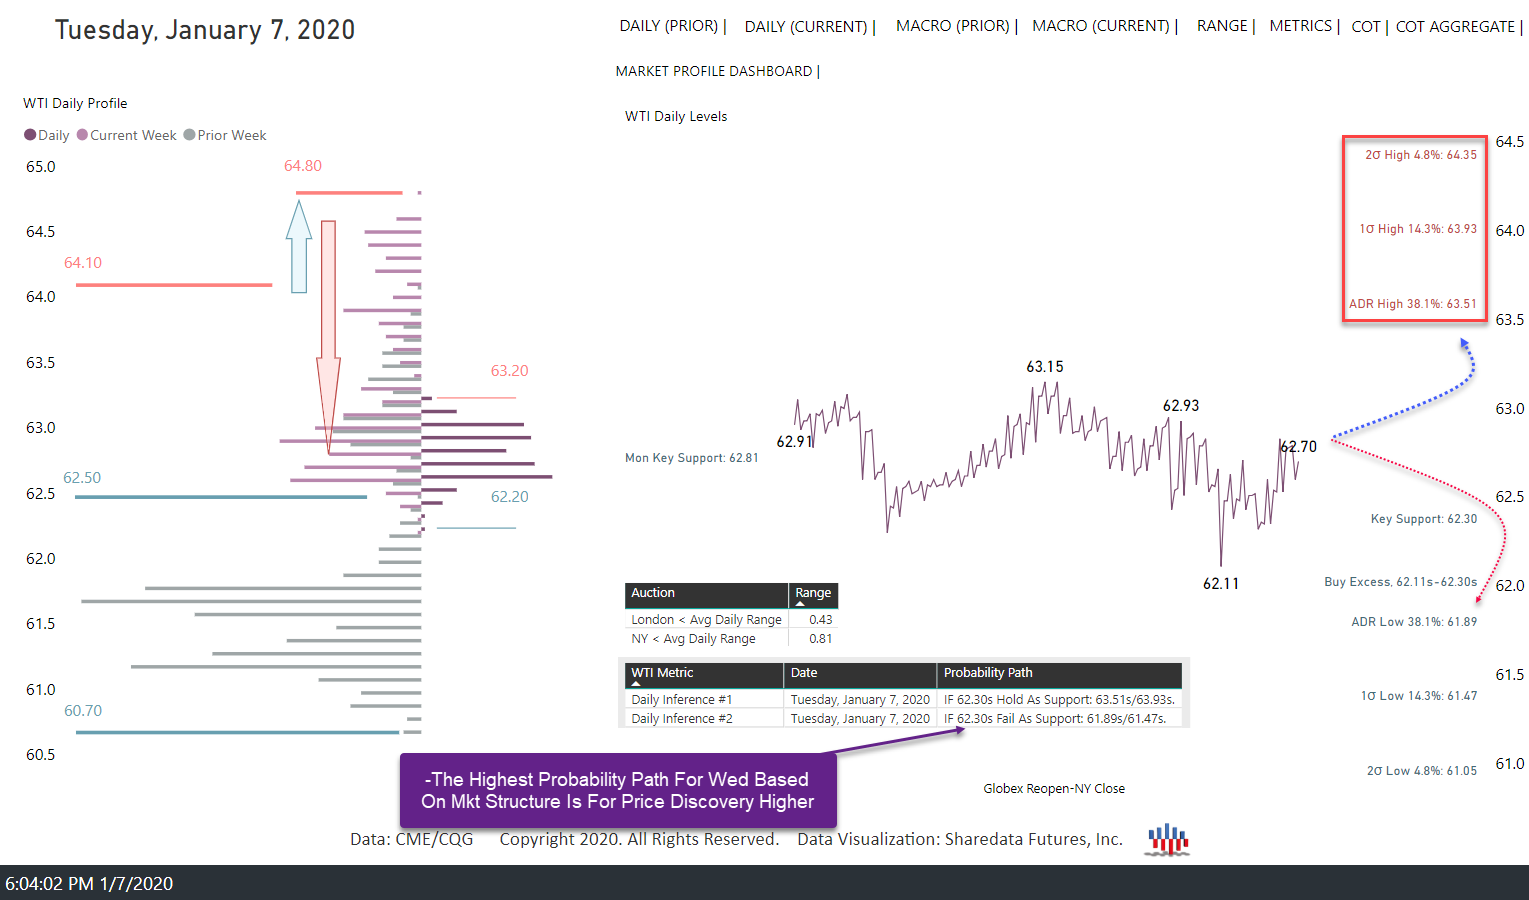
| January 8, 2020: The structural framework provided in Sharedata's Daily Dashboard for Wednesday, January 8 was for price discovery higher. Our daily dual probability path assigned the primary expectation for price discovery higher, noting statistical resistance targets were: 63.51s/63.93s/64.35s, respectively. Qualitatively, these levels had held as resistance 62%, 86%, and 95% of recent market auctions (respectively) based on the market generated data. This data provided a buy-side framework with a probable resistance "zone" between 63.51s-63.93s. As discussed frequently, markets are probabilistic not deterministic. Within this framework, the secondary expectation was for price discovery lower with a probable support "zone" between 61.89s-61.47s. This type of daily framework, while useful, is more effective when using live order flow and structural analysis to confirm or negate the most probable daily inference. |
|
| Energy Daily Dashboard 07Jan20 |
| Graphic provided by: Sharedata Futures, Inc.. |
| |
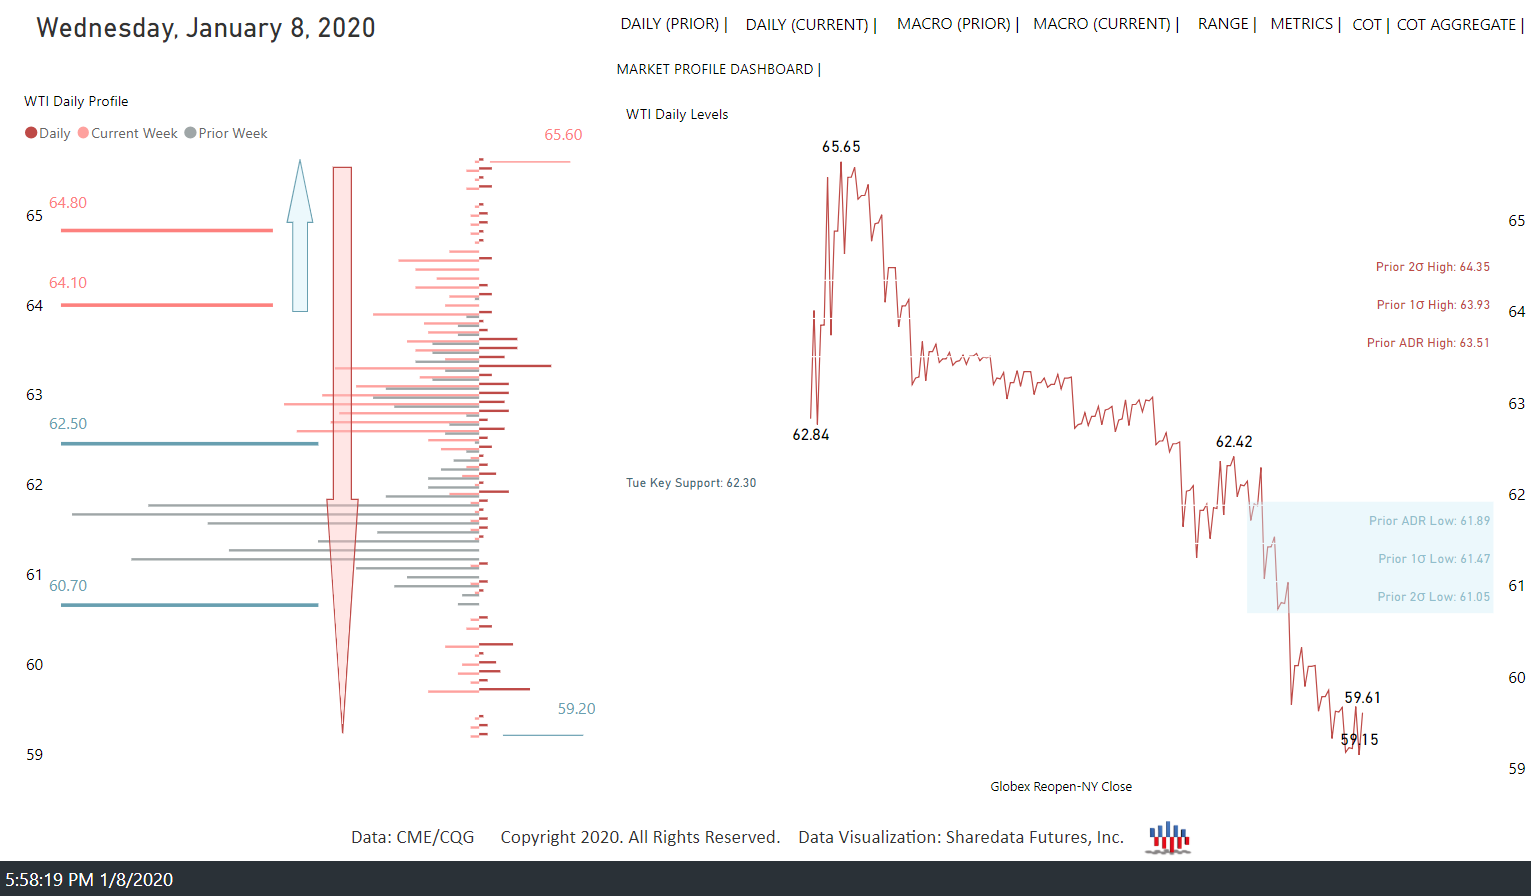
| Late in Tuesday's auction, news of Iranian strikes on Iraqi facilities crossed newswires. Tuesday's key support held as aggressive price discovery higher developed through all of Wednesday's statistical resistance targets to 65.65s during Wednesday's Asian auction. Selling interest emerged around 65s amidst sell excess, halting the buy-side sequence. Price discovery lower then ensued toward 63.20s into the London open. Buyers trapped there before sellside continuation developed through key support, achieving a stopping point, 61.31s, at/near Sharedata's 1st standard deviation low target into the NY open. Buyers were trapped again, early in NY trade, driving price lower to 59.15s, beyond the maximum daily statistical expectancy. Sellers were trapped there, driving price modestly higher into the NY close. |
|
| Energy Daily Dashboard 08Jan20 |
| Graphic provided by: Sharedata Futures, Inc.. |
| |
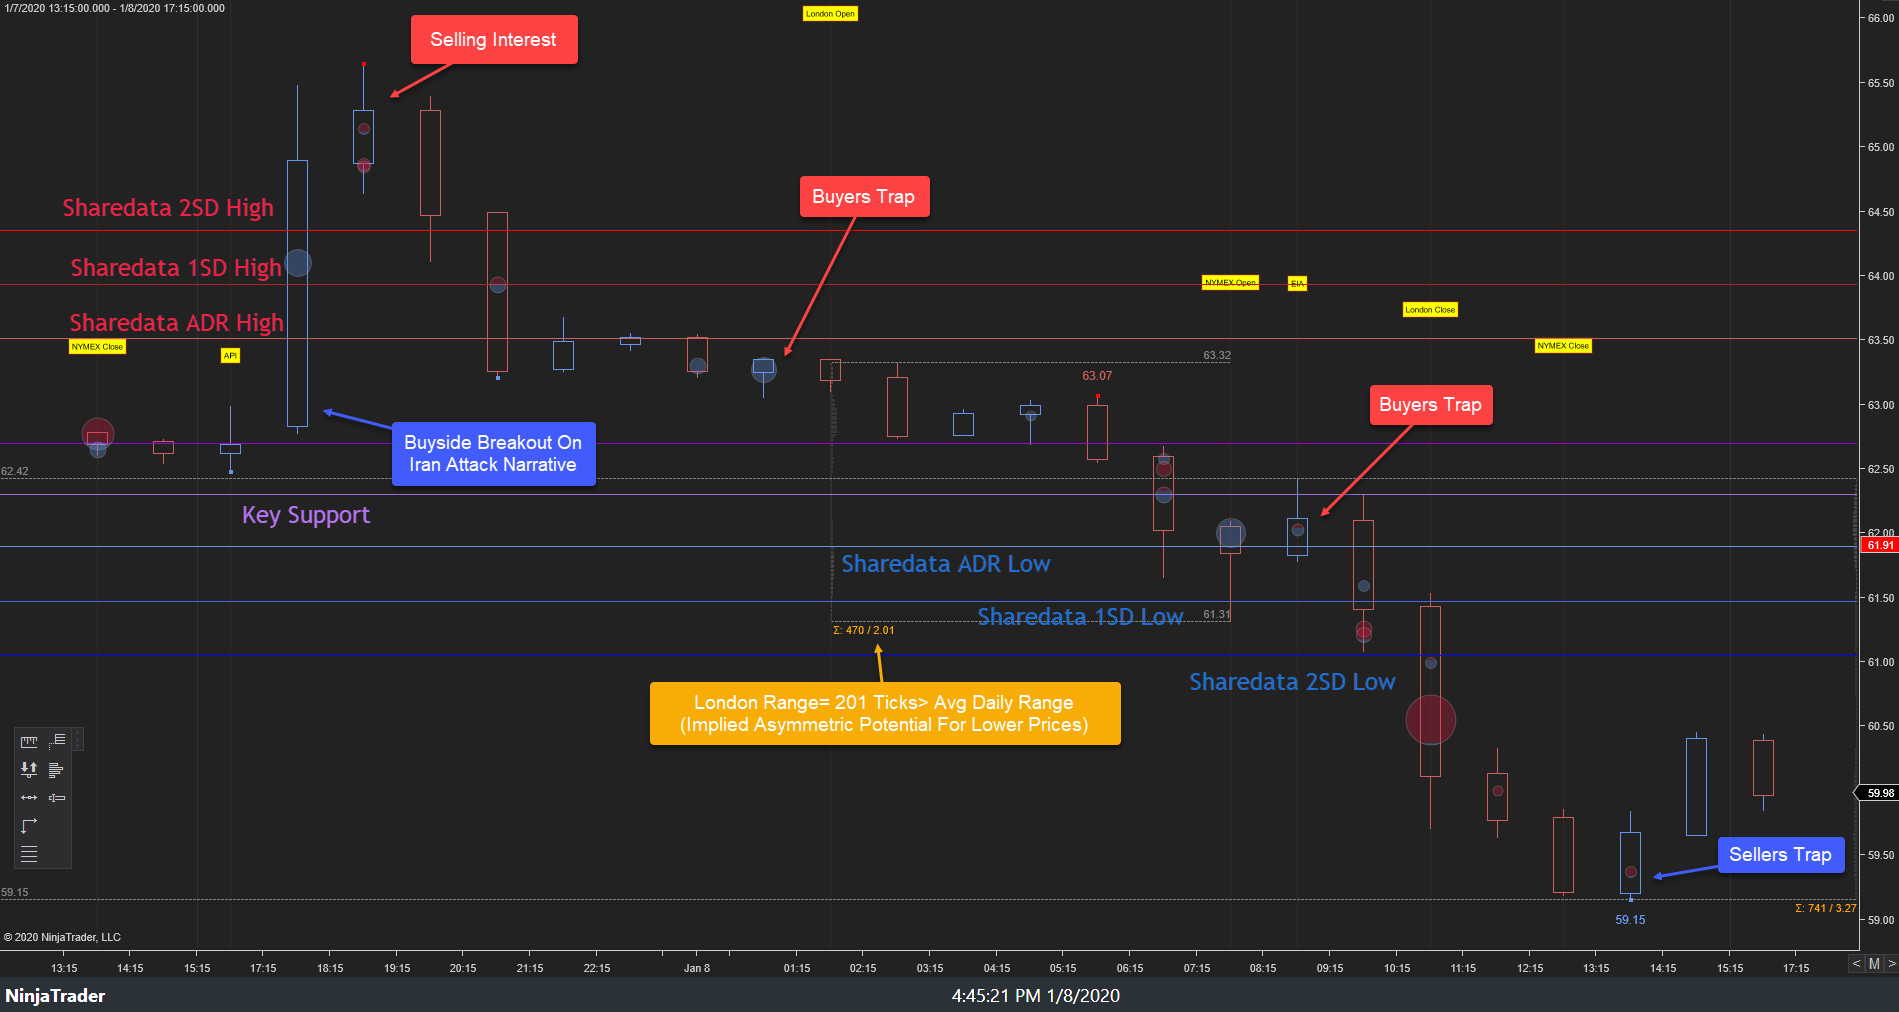
| In this week's analysis, the key market structure development was structural sell excess that developed amidst selling interest at/near 65.65s in the Asian auction. This development was indication and warning that the primary daily inference (price discovery higher) had been terminated. The failure at key resistance directed attention to key statistical support targets below: 60.04s/59.48s/58.91s, respectively. Given the geo-political circumstances, it was also reasonable to infer that price discovery lower beyond the daily statistical support targets could develop. The London auction ultimately saw a trade range of 201 ticks (beyond the London auction's 2nd standard deviation rotation). Based on the market generated data, when London auctions exhibit this range amplitude, there is asymmetric potential for continuation (in this case lower) in the direction of trend. The market ultimately auctioned to 59.15s, 216 ticks lower from London support. |
|
| WTI Daily Auction 08Jan20 |
| Graphic provided by: NinjaTrader. |
| |
| Statistical analyses, in this case of London range amplitude, helped inform as to the potential for trend continuation. Even though the market had traded lower from the overnight high approximately 420 ticks in the NY open, the London market structure suggested potential for sellside continuation (rather than a pullback buying opportunity). |
|
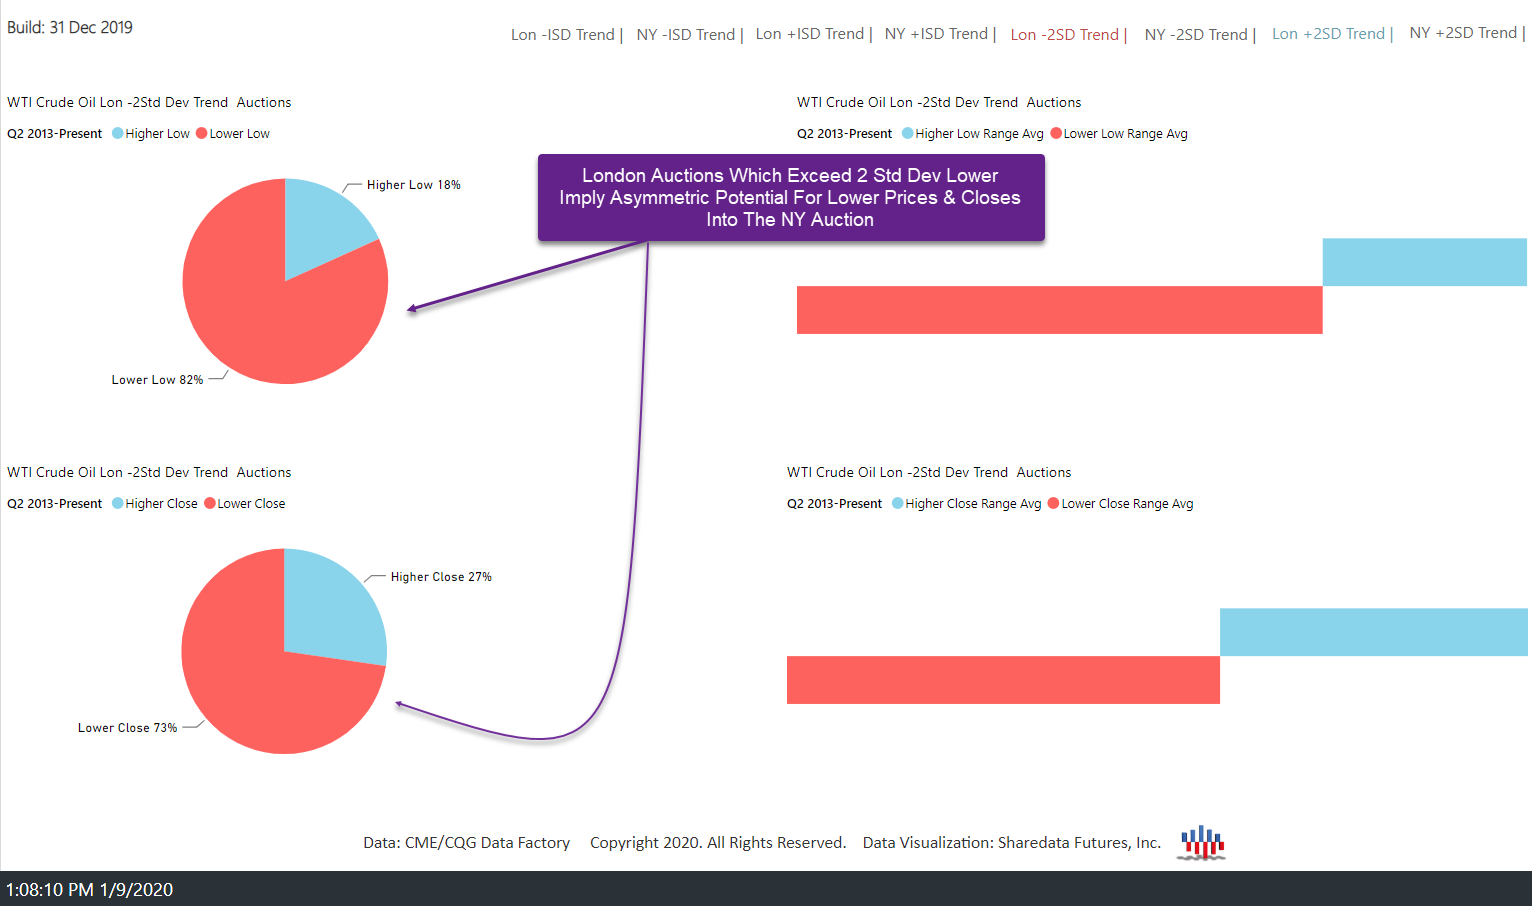
| Directional Trend Dashboard 07Jan20 (London 2nd Standard Deviation Lower Auctions) |
| Graphic provided by: Sharedata Futures, Inc.. |
| |
| The order flow and limit order book data confirmed the sell-side development of the directional context provided by the market structure. The daily framework identified statistical support targets and their qualitative potential to hold as support. This confluence of structural, statistical, and order flow data provided insight into the auction's outcome based not on lagging fundamental data or media hype but rather structural formation and transactional behavior of significant quantity that drives price discovery. |
Sharedata Futures, Inc. provides historical data mining and visualization for the benchmark NYMEX Energy Futures Markets.
Sharedata combines structural analysis of the market generated data, dynamic systems analysis, and Bayesian causal inference techniques favored by the scientific and intelligence communities to provide a robust framework for addressing the uncertainty and risk in energy pricing.
| Title: | Founder |
| Company: | Sharedata Futures, Inc. |
| Dallas, TX | |
| Website: | www.sdfanalytics.com |
| E-mail address: | support@sdfanalytics.com |
Traders' Resource Links | |
| Sharedata Futures, Inc. has not added any product or service information to TRADERS' RESOURCE. | |
Click here for more information about our publications!
PRINT THIS ARTICLE

Request Information From Our Sponsors
- StockCharts.com, Inc.
- Candle Patterns
- Candlestick Charting Explained
- Intermarket Technical Analysis
- John Murphy on Chart Analysis
- John Murphy's Chart Pattern Recognition
- John Murphy's Market Message
- MurphyExplainsMarketAnalysis-Intermarket Analysis
- MurphyExplainsMarketAnalysis-Visual Analysis
- StockCharts.com
- Technical Analysis of the Financial Markets
- The Visual Investor
- VectorVest, Inc.
- Executive Premier Workshop
- One-Day Options Course
- OptionsPro
- Retirement Income Workshop
- Sure-Fire Trading Systems (VectorVest, Inc.)
- Trading as a Business Workshop
- VectorVest 7 EOD
- VectorVest 7 RealTime/IntraDay
- VectorVest AutoTester
- VectorVest Educational Services
- VectorVest OnLine
- VectorVest Options Analyzer
- VectorVest ProGraphics v6.0
- VectorVest ProTrader 7
- VectorVest RealTime Derby Tool
- VectorVest Simulator
- VectorVest Variator
- VectorVest Watchdog