HOT TOPICS LIST
- MACD
- Fibonacci
- RSI
- Gann
- ADXR
- Stochastics
- Volume
- Triangles
- Futures
- Cycles
- Volatility
- ZIGZAG
- MESA
- Retracement
- Aroon
INDICATORS LIST
LIST OF TOPICS
PRINT THIS ARTICLE
by Gary Grosschadl
This networking leader soared with the markets off October lows only to be stopped by a double top. Now it has made a retracement to a likely key support area.
Position: Buy
Gary Grosschadl
Independent Canadian equities trader and technical analyst based in Peterborough
Ontario, Canada.
PRINT THIS ARTICLE
SUPPORT & RESISTANCE
Cisco Systems Retraces To A Buying Opportunity
12/27/02 12:15:03 PMby Gary Grosschadl
This networking leader soared with the markets off October lows only to be stopped by a double top. Now it has made a retracement to a likely key support area.
Position: Buy
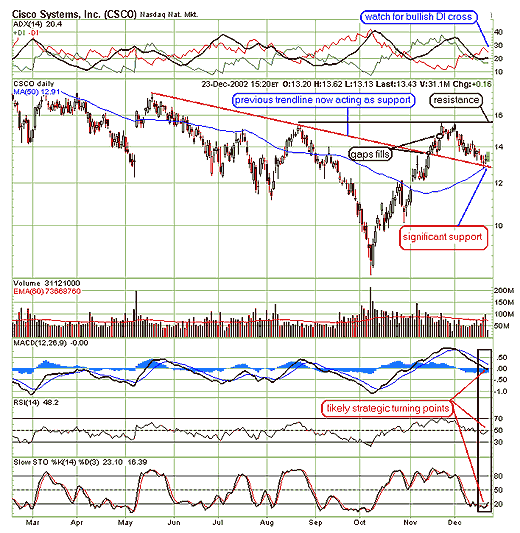
| As the chart shows, Cisco ran into a previous resistance level from last August and proceeded to make a small double top. The correction that followed more than fulfilled that topping formation by measurement (the double top to trough is about $1 vs. the $1.70 actual decline from the trough) as two previous gaps were filled. When a stock gets ahead of itself it often comes back down to fill previous gaps before resuming its advance. |
| By drawing the previous trendline that was broken to the upside by the last advance, we have a support target. So far this support area has held. Note that this trendline also coincides with CSCO's 50-day moving average, currently at 12.91. This combined support should be a significant level. This move back down to the trendline illustrates the principal of "what was resistance becomes support." |

|
| Graphic provided by: StockCharts.com. |
| |
| The displayed indicators show the promise of support but need improvement reinforce this chart's bullish intent. The directional movement indicator ADX/DI shows an improving but still bearish setup: -DI is starting to weaken as +DI has stopped declining. If bullishness continues, these DIs will converge further and may eventually cross, adding additional bullish power. Meanwhile the MACD (moving average convergence/divergence) indicator shows the chance of a reversal at or near the zero line. Likewise the RSI index shows an uptick to the 50-percent level. A move above this 50-percent level would be bullish just as refusal to do so is bearish. This 50-percent level often marks turning points. The stochastics oscillator shows an attempt to move past an oversold situation. This indicator needs to build momentum past this 20-day level to reflect bullish improvement. |
| At this point Cisco is a buy for aggressive traders anticipating further bullishness as hinted by this chart. Resistance levels going forward from here are $14, gap resistance at $14.50, and finally the previous top that occured around $15.45. Reversals at any of these points may lead to another test of the lower trendline. Two suggested "uncle" points for longs selling their positions on weakness would be a move under the 50-day moving average or a move below the red trendline, should this early bullishness fail. Otherwise short-term traders can target those upside resistance levels to consider locking in profits or simply ride the move up until signs of reversal are met. |
Independent Canadian equities trader and technical analyst based in Peterborough
Ontario, Canada.
| Website: | www.whatsonsale.ca/financial.html |
| E-mail address: | gwg7@sympatico.ca |
Click here for more information about our publications!
Comments
Date: 12/28/02Rank: 4Comment:
Date: 12/28/02Rank: 4Comment:
Date: 12/28/02Rank: Comment: I think this support will be broken
He didn t show triple tops june ,ag, and november
The key support level is +-12.25
If broken adjust by fibo retracement
dgue@terra.com
Date: 12/29/02Rank: 3Comment:
Date: 12/29/02Rank: Comment: You refer to the 50 day level in the RSI indicator(not index).Since this is a 14 day RSI I believe you mean the 50% level. I do agree with your analysis.
Date: 12/29/02Rank: 5Comment:
Date: 01/06/03Rank: 5Comment: I like articles that show and describe the analysis of an example chart. Very nice!
Thanks!

|

Request Information From Our Sponsors
- StockCharts.com, Inc.
- Candle Patterns
- Candlestick Charting Explained
- Intermarket Technical Analysis
- John Murphy on Chart Analysis
- John Murphy's Chart Pattern Recognition
- John Murphy's Market Message
- MurphyExplainsMarketAnalysis-Intermarket Analysis
- MurphyExplainsMarketAnalysis-Visual Analysis
- StockCharts.com
- Technical Analysis of the Financial Markets
- The Visual Investor
- VectorVest, Inc.
- Executive Premier Workshop
- One-Day Options Course
- OptionsPro
- Retirement Income Workshop
- Sure-Fire Trading Systems (VectorVest, Inc.)
- Trading as a Business Workshop
- VectorVest 7 EOD
- VectorVest 7 RealTime/IntraDay
- VectorVest AutoTester
- VectorVest Educational Services
- VectorVest OnLine
- VectorVest Options Analyzer
- VectorVest ProGraphics v6.0
- VectorVest ProTrader 7
- VectorVest RealTime Derby Tool
- VectorVest Simulator
- VectorVest Variator
- VectorVest Watchdog
