

HOT TOPICS LIST
- MACD
- Fibonacci
- RSI
- Gann
- ADXR
- Stochastics
- Volume
- Triangles
- Futures
- Cycles
- Volatility
- ZIGZAG
- MESA
- Retracement
- Aroon
INDICATORS LIST
LIST OF TOPICS
PRINT THIS ARTICLE
by Fawad Razaqzada
Deciding on the use of particular moving averages (MA) depend on several factors, but there is definitely a trade-off between choosing a short-term over a longer-term MA, and vice versa.
Position: N/A
Fawad Razaqzada
Fawad Razaqzada is an experienced analyst and economist having been involved in the financial markets since 2010 working for leading global FX and CFD brokerages. Having graduated with a degree in economics and leveraging years of financial market experience, Fawad provides retail and professional traders worldwide with succinct fundamental & technical analysis. In addition, he also offers premium trade signals to subscribers, and trading education to help shorten the learning curves of developing traders. He has also been trading on his personal account for many years. Follow Fawad on twitter @Trader_F_R or visit his website at TradingCandles.com.
PRINT THIS ARTICLE
MA CROSS
Moving Averages And Opportunity Costs
12/20/19 04:14:02 PMby Fawad Razaqzada
Deciding on the use of particular moving averages (MA) depend on several factors, but there is definitely a trade-off between choosing a short-term over a longer-term MA, and vice versa.
Position: N/A
| When deciding on the type and period of moving averages to use, would you rather: (A) try and catch the trend in its early parts of development and risk being prematurely stopped out, or (B) miss out on a big chunk of the initial move in an effort to remain in the trade in case a strong trend develops? |
| That's a key trade-off facing many traders. Let's say you are a short-term trader and your strategy is to buy above or sell below the 21-period exponential moving average. If you are lucky enough to catch a nice strong trend, then your potential gains could be significant, and losses limited. The flip side is, when markets are not trending well you will see lots of fake outs above or below the average, potentially resulting in reduced profits, or worse, lots of premature stop-outs eventually putting a big dent in your account. |
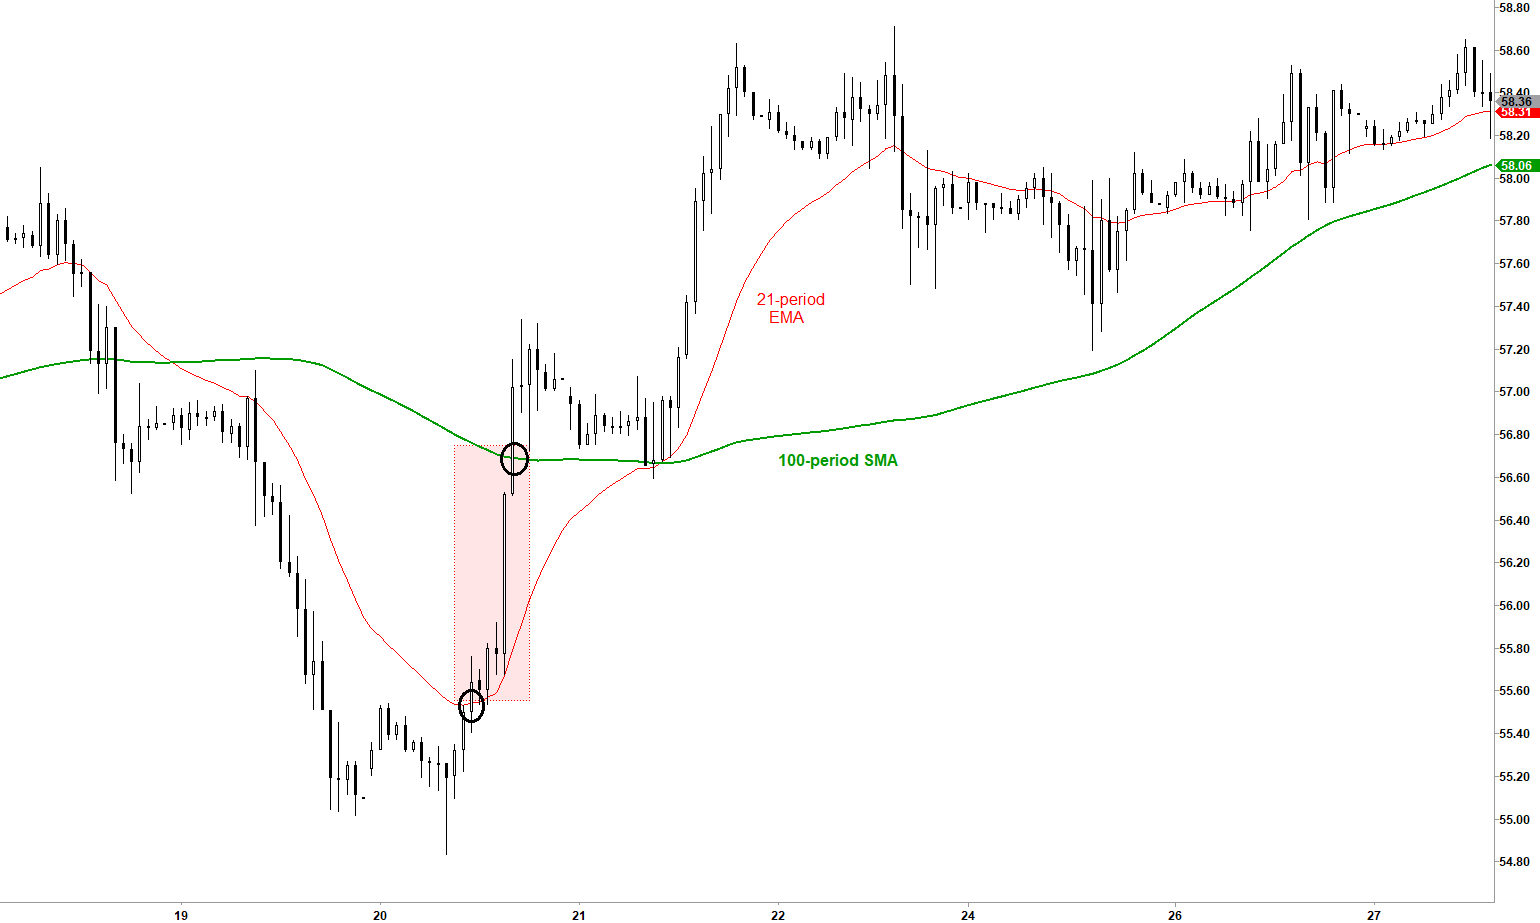
| As a hypothetical example, let's say there are two traders who buy and sell when price crosses moving averages on the 1-hour time frame. Trader A buys when price goes above the 21-period exponential MA and sells when it goes back below. Trader B goes long when price breaks through the 100-period simple moving average and sells when price goes below it. For this example, refer to the 1-hour chart of WTI Crude Oil in Figure 1. After price formed a reversal, it quickly moved north of the 21-period exponential average. It then exploded higher over the next several hours to finally move above the 100-period simple moving average. The time it took for price to move between these averages roughly represented 100 points of gains that Trader A benefited from and Trader B, waiting for break of 100-SMA, missed out on. |
|
| Figure 1. 1-hour chart of WTI Crude Oil with 21-EMA (red) and 100-SMA (green). |
| Graphic provided by: eSignal. |
| |
| In other words, this was the opportunity cost (as represented in red shading on the chart) of opting for more confirmation and going for the 100-SMA. However, when the rally ended as price went back below the 21-EMA, this caused Trader A to close out his long trade and initiate a short position. Trader A then got whipsawed several times as price consolidated. During this consolidation, price stayed well above the 100-period SMA, meaning that Trader B not only managed to remain in his long trade, he also didn't lose any money by being churned like Trader A. What's more, Trader B could have made significantly more profit in the event price continued trending higher without going back below the 100-SMA first. Obviously, this a hypothetical scenario and in reality, most people's trading systems are more advanced than what I have just described. But there is definitely a trade-off when it comes to choosing the period of the moving average that you are going to use. |
| To help chose the "correct" moving average or averages, there are a number of things you need to consider. First, if you are following a particular strategy which requires you to use particular MAs, and back tests prove it makes money, then in this case your decision is a simple one: follow the strategy and don't change the moving averages. But if you are ready to experiment and develop your own system or strategy, then in an effort to reduce the number of false signals it is quite common to have more than one moving average on your charts. These crossover-type of systems have their own advantages and disadvantages. But essentially, they can be a good way of filtering out bad signals. The decision on choosing between the moving averages can also depend on the maturity of the trend. If the trend is very strong with price making only shallow retracements — as in the case of the S&P 500 in recent times — then using a short-term exponential moving average makes more sense than waiting for a big correction to the 200-day simple average, if you are active trader. Conversely, if a trend is in the early stages of development then it is quite common for price to make deep retracements. In this case, you may consider using a longer-term MA for buying and selling decisions. |
Fawad Razaqzada is an experienced analyst and economist having been involved in the financial markets since 2010 working for leading global FX and CFD brokerages. Having graduated with a degree in economics and leveraging years of financial market experience, Fawad provides retail and professional traders worldwide with succinct fundamental & technical analysis. In addition, he also offers premium trade signals to subscribers, and trading education to help shorten the learning curves of developing traders. He has also been trading on his personal account for many years. Follow Fawad on twitter @Trader_F_R or visit his website at TradingCandles.com.
| Title: | Financial Market Analyst |
| Company: | TradingCandles.com |
| London, | |
| Website: | tradingcandles.com |
| E-mail address: | fawad.razaqzada@hotmail.co.uk |
Traders' Resource Links | |
| TradingCandles.com has not added any product or service information to TRADERS' RESOURCE. | |
Click here for more information about our publications!
Comments
Date:�12/29/19Rank:�3Comment:�Why was the 21 MA used? Why not the 12 or 9 or any number for that reason. To me, applying an arbitrary number for the SMA or EMA is like trying to find the right time frame to chose. If it accomplishes your goals, then use it. If not, then try another way. And never rely on just one type of indicator alone!
Date:�01/09/20Rank:�4Comment:�

Request Information From Our Sponsors
- StockCharts.com, Inc.
- Candle Patterns
- Candlestick Charting Explained
- Intermarket Technical Analysis
- John Murphy on Chart Analysis
- John Murphy's Chart Pattern Recognition
- John Murphy's Market Message
- MurphyExplainsMarketAnalysis-Intermarket Analysis
- MurphyExplainsMarketAnalysis-Visual Analysis
- StockCharts.com
- Technical Analysis of the Financial Markets
- The Visual Investor
- VectorVest, Inc.
- Executive Premier Workshop
- One-Day Options Course
- OptionsPro
- Retirement Income Workshop
- Sure-Fire Trading Systems (VectorVest, Inc.)
- Trading as a Business Workshop
- VectorVest 7 EOD
- VectorVest 7 RealTime/IntraDay
- VectorVest AutoTester
- VectorVest Educational Services
- VectorVest OnLine
- VectorVest Options Analyzer
- VectorVest ProGraphics v6.0
- VectorVest ProTrader 7
- VectorVest RealTime Derby Tool
- VectorVest Simulator
- VectorVest Variator
- VectorVest Watchdog