HOT TOPICS LIST
- MACD
- Fibonacci
- RSI
- Gann
- ADXR
- Stochastics
- Volume
- Triangles
- Futures
- Cycles
- Volatility
- ZIGZAG
- MESA
- Retracement
- Aroon
INDICATORS LIST
LIST OF TOPICS
PRINT THIS ARTICLE
by Matt Blackman
Many stocks show impressive periods of seasonal strength and weakness. However, as we shall see, it's imperative to give any cyclical pattern a closer look before trading it.
Position: N/A
Matt Blackman
Matt Blackman is a full-time technical and financial writer and trader. He produces corporate and financial newsletters, and assists clients in getting published in the mainstream media. Matt has earned the Chartered Market Technician (CMT) designation. Follow Matt on Twitter at www.twitter.com/RatioTrade
PRINT THIS ARTICLE
SEASONAL TRADING
Trading Seasons
12/20/19 04:05:14 PMby Matt Blackman
Many stocks show impressive periods of seasonal strength and weakness. However, as we shall see, it's imperative to give any cyclical pattern a closer look before trading it.
Position: N/A
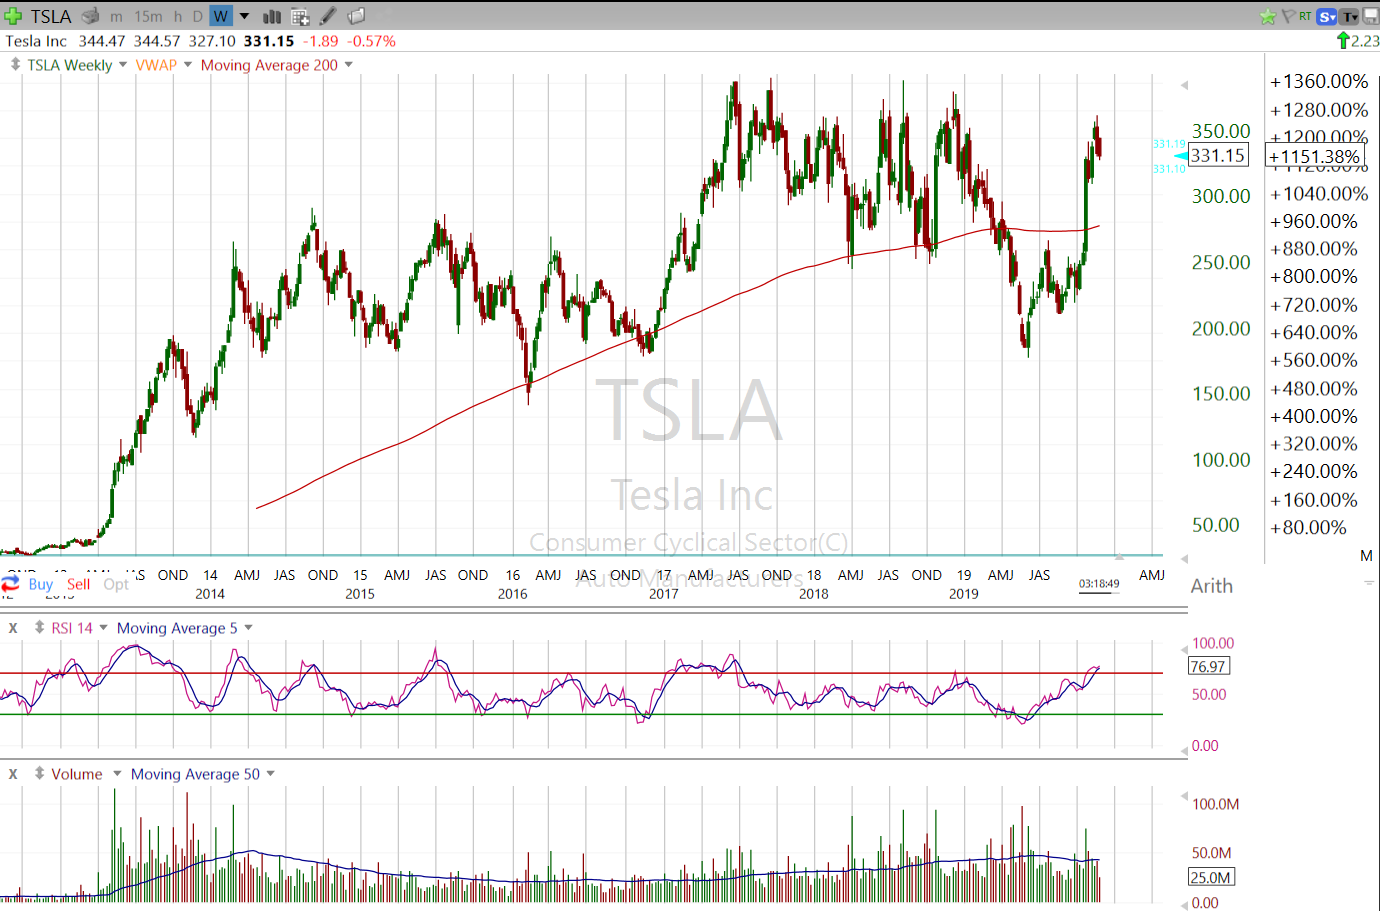
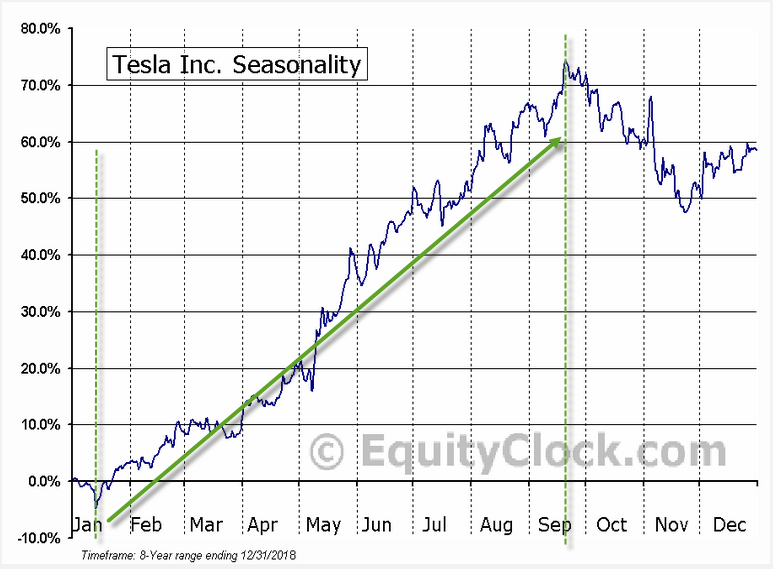
| Tesla, Inc. began trading on June 29, 2010 at an IPO price of $17.00 per share. It hit an all-time high of $389.61 on March 18, 2017, which would have earned a buy and hold investor an impressive 2,000+% return (see Figure 1). But as history has shown, TSLA has been nothing if not volatile and subject to huge price swings driven by a powerful combination of comments by CEO Elon Musk and news events. As we see in Figure 2, TSLA has demonstrated strong seasonal performance. But while it's tempting to adopt a strategy to exploit this behavior, it is crucial to determine if this seasonal trend is as effective as it was when the stock experienced its impressive gains. |

|
| Figure 1. Weekly TSLA chart showing strong price appreciation between 2011 and 2014, and again in 2017. But since peaking that year, it has been stuck in a wide, volatile range. |
| Graphic provided by: Freestockcharts.com. |
| |
| Figure 2 shows how TSLA has performed between mid-January and the last week in September during the average year, posting an average seasonal gain of 75% during its eight year history. |

|
| Figure 2. Seasonal chart showing strong performance over a nine month period. |
| Graphic provided by: EquityClock.com. |
| |
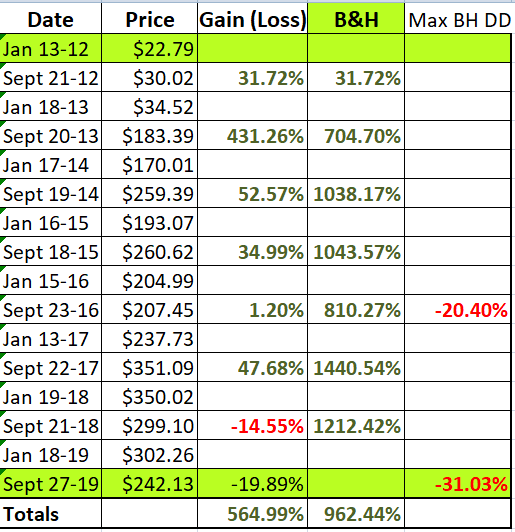
| Next we analyze this seasonal strategy on a trade-by-trade basis between 2012 and 2019. It performed well, earning a 600% gross profit for the seasonal trader between January 2012 and September 2017. It suffered its first drawdown of 14.6% in 2018. However, this method looks less attractive when compared to a buy & hold return of 1440% with a max drawdown of 20.4% over the same period. Overall, our seasonal technique would have earned a gross return of 565% versus 962% for a buy and hold between 2012 and November 2019. Unfortunately, since 2018 both methods have performed poorly as we see from the table in Figure 3. Buying January 2, 2018 and selling November 27, 2019 would have earned the buy and hold investor a meager 3.4% less expenses versus a loss of 30.8% for the seasonal trader making two trades over the same period. |

|
| Figure 3. Table comparing a seasonal trading strategy a buy & hold. |
| Graphic provided by: Spreadsheet by Matt Blackman. |
| |
| This exercise demonstrates the importance of doing your homework on what may seem like a slam-dunk at first glance before adopting it. |
Matt Blackman is a full-time technical and financial writer and trader. He produces corporate and financial newsletters, and assists clients in getting published in the mainstream media. Matt has earned the Chartered Market Technician (CMT) designation. Follow Matt on Twitter at www.twitter.com/RatioTrade
| Title: | Author |
| Company: | TradeSystemGuru |
| Address: | Box 2589 |
| Garibaldi Highlands, BC V0N1T0 | |
| Phone # for sales: | 6048989069 |
| E-mail address: | indextradermb@gmail.com |
Traders' Resource Links | |
| TradeSystemGuru has not added any product or service information to TRADERS' RESOURCE. | |
Click here for more information about our publications!
Comments

|

Request Information From Our Sponsors
- StockCharts.com, Inc.
- Candle Patterns
- Candlestick Charting Explained
- Intermarket Technical Analysis
- John Murphy on Chart Analysis
- John Murphy's Chart Pattern Recognition
- John Murphy's Market Message
- MurphyExplainsMarketAnalysis-Intermarket Analysis
- MurphyExplainsMarketAnalysis-Visual Analysis
- StockCharts.com
- Technical Analysis of the Financial Markets
- The Visual Investor
- VectorVest, Inc.
- Executive Premier Workshop
- One-Day Options Course
- OptionsPro
- Retirement Income Workshop
- Sure-Fire Trading Systems (VectorVest, Inc.)
- Trading as a Business Workshop
- VectorVest 7 EOD
- VectorVest 7 RealTime/IntraDay
- VectorVest AutoTester
- VectorVest Educational Services
- VectorVest OnLine
- VectorVest Options Analyzer
- VectorVest ProGraphics v6.0
- VectorVest ProTrader 7
- VectorVest RealTime Derby Tool
- VectorVest Simulator
- VectorVest Variator
- VectorVest Watchdog
