HOT TOPICS LIST
- MACD
- Fibonacci
- RSI
- Gann
- ADXR
- Stochastics
- Volume
- Triangles
- Futures
- Cycles
- Volatility
- ZIGZAG
- MESA
- Retracement
- Aroon
INDICATORS LIST
LIST OF TOPICS
PRINT THIS ARTICLE
by Matt Blackman
Fossil fuel stocks have been under pressure of late but Diamondback has successfully fought this trend. But are its days as outperformer coming to an end?
Position: Sell
Matt Blackman
Matt Blackman is a full-time technical and financial writer and trader. He produces corporate and financial newsletters, and assists clients in getting published in the mainstream media. Matt has earned the Chartered Market Technician (CMT) designation. Follow Matt on Twitter at www.twitter.com/RatioTrade
PRINT THIS ARTICLE
HEAD & SHOULDERS
Diamondback Under Pressure
12/05/19 04:49:54 PMby Matt Blackman
Fossil fuel stocks have been under pressure of late but Diamondback has successfully fought this trend. But are its days as outperformer coming to an end?
Position: Sell
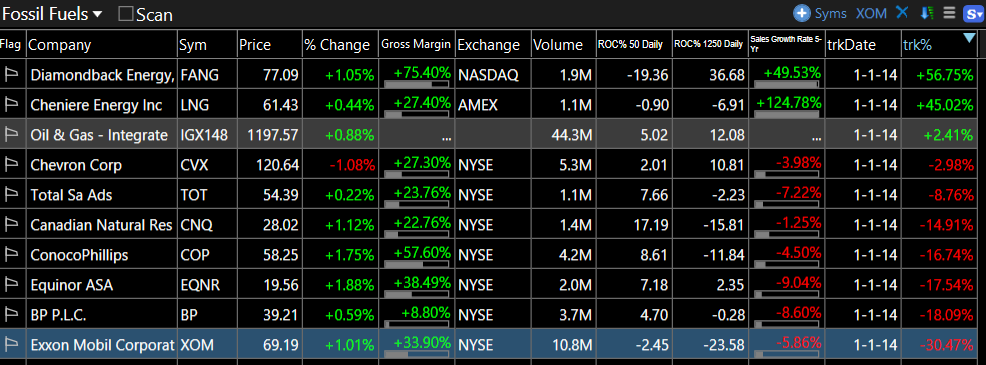
| Since 2014, fossil fuel stocks have struggled under a trifecta of falling oil & gas prices, rising green energy competition and greenhouse gas emissions reduction pressures. Diamondback Energy, Inc. (FANG) has been the top performer of a group of more than 20 fossil fuel stocks, having risen more than 50% in the last six years (see Figure 2). |

|
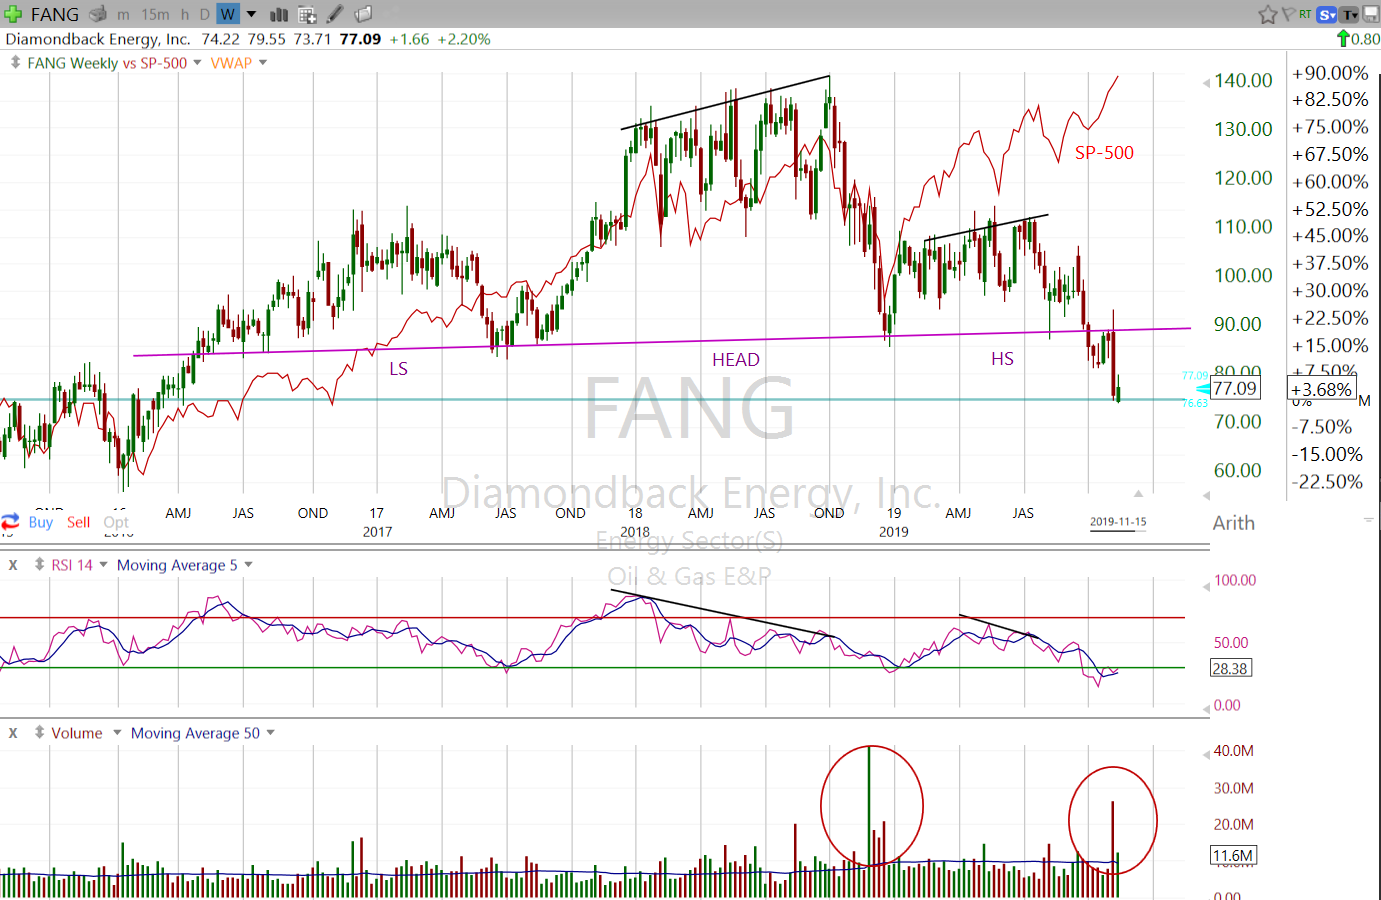
| Figure 1. Weekly chart of Diamondback Energy (FANG) showing the formation of a bearish Head & Shoulders pattern which was confirmed in early October as it breached the H&S neckline. |
| Graphic provided by: Freestockcharts.com. |
| |
| But as we see in Figure 1, a bearish Head & Shoulder pattern began forming in 2017 and was confirmed with the neckline breach in the first week of October and subsequent neckline retest and failure shortly thereafter. This pattern was further confirmed by higher volumes at crucial rally failure points (see red circles) and bearish RSI divergence at both the head and right shoulder. |

|
| Figure 2. Table showing the best performers of a portfolio of more than 20 fossil fuels stocks. The last column shows the gains (losses) since January 2014 to mid-November 2019. |
| Graphic provided by: Freestockcharts.com. |
| |
| So how does the future look for fossil fuels? According to a September 3 article entitled "Exxon Mobil Slides Out Of S&P 500 Top 10", "Four decades ago, energy companies made up 25% of the S&P 500 index. Now it's 4%." In 1980 seven of the top ten S&P stocks were fossil fuels. Now there are none — Exxon Mobil dropped out S&P top ten this year. |

|
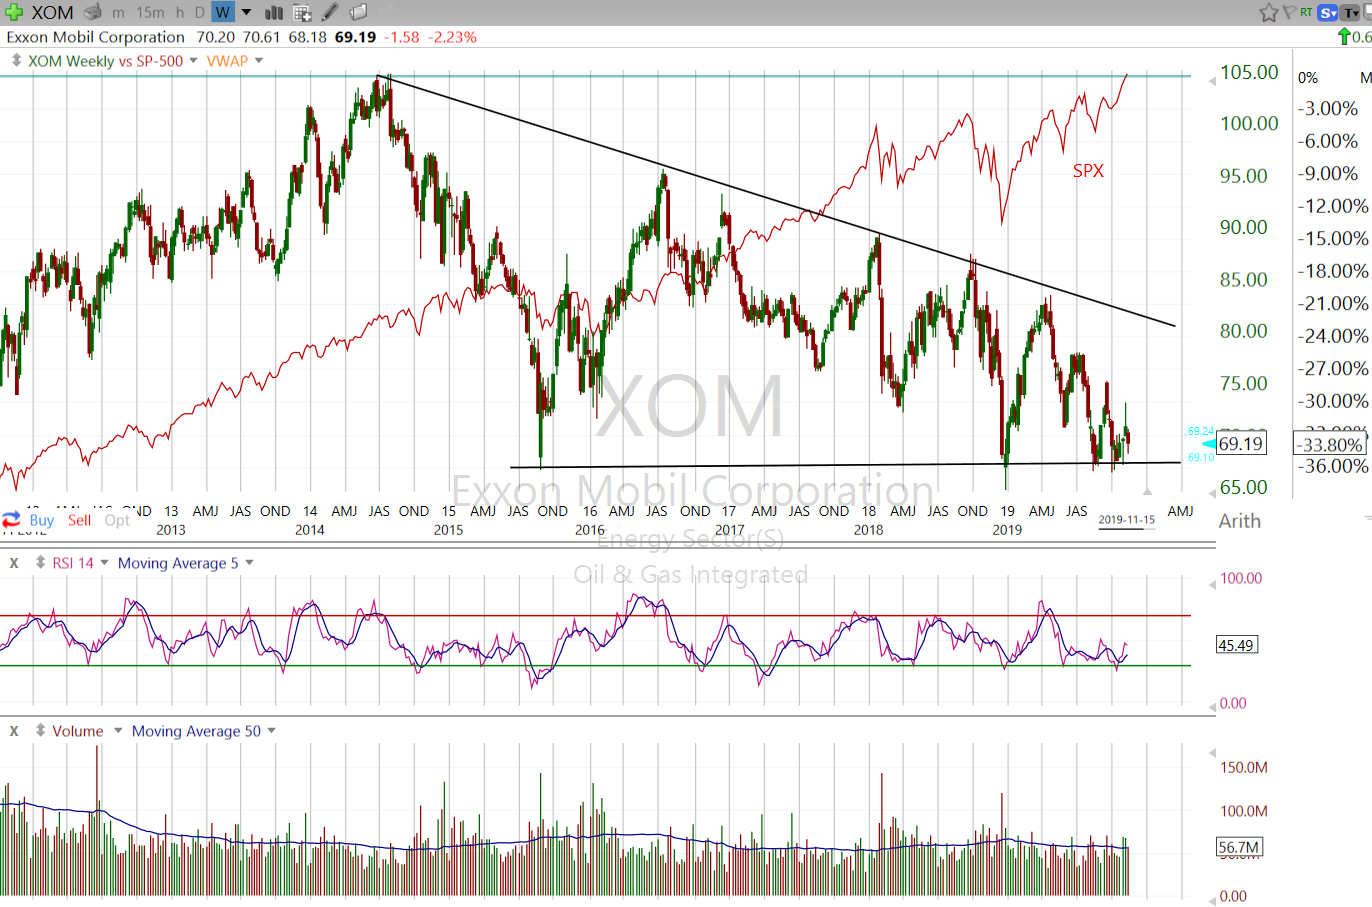
| Figure 3. Weekly chart of ExxonMobil (XOM) compared to the S&P 500 Index. |
| Graphic provided by: Freestockcharts.com. |
| |
| As we see from Figure 3, ExxonMobil (XOM) has lost more than 30% of its value since 2014 and the chart is showing little sign of a reversal. According to a 2018 report entitled "The Financial Case for Fossil Fuel Divestment" from the Institute for Energy Economics and Financial Analysis, Exxon "had revenues of $466 billion in 2008 and approximately half that in 2017, at $237 billion." |
| So is it time to start focusing on new economy energy and technology stocks like solar component manufacturer Enphase Energy going forward (see Suggested Reading)? Suggested Reading: Seasons In The Sun Enphase Energy - New Economy Shiner? Exxon Mobil Slides Out Of S&P 500 Top 10 |
Matt Blackman is a full-time technical and financial writer and trader. He produces corporate and financial newsletters, and assists clients in getting published in the mainstream media. Matt has earned the Chartered Market Technician (CMT) designation. Follow Matt on Twitter at www.twitter.com/RatioTrade
| Title: | Author |
| Company: | TradeSystemGuru |
| Address: | Box 2589 |
| Garibaldi Highlands, BC V0N1T0 | |
| Phone # for sales: | 6048989069 |
| E-mail address: | indextradermb@gmail.com |
Traders' Resource Links | |
| TradeSystemGuru has not added any product or service information to TRADERS' RESOURCE. | |
Click here for more information about our publications!
PRINT THIS ARTICLE

Request Information From Our Sponsors
- StockCharts.com, Inc.
- Candle Patterns
- Candlestick Charting Explained
- Intermarket Technical Analysis
- John Murphy on Chart Analysis
- John Murphy's Chart Pattern Recognition
- John Murphy's Market Message
- MurphyExplainsMarketAnalysis-Intermarket Analysis
- MurphyExplainsMarketAnalysis-Visual Analysis
- StockCharts.com
- Technical Analysis of the Financial Markets
- The Visual Investor
- VectorVest, Inc.
- Executive Premier Workshop
- One-Day Options Course
- OptionsPro
- Retirement Income Workshop
- Sure-Fire Trading Systems (VectorVest, Inc.)
- Trading as a Business Workshop
- VectorVest 7 EOD
- VectorVest 7 RealTime/IntraDay
- VectorVest AutoTester
- VectorVest Educational Services
- VectorVest OnLine
- VectorVest Options Analyzer
- VectorVest ProGraphics v6.0
- VectorVest ProTrader 7
- VectorVest RealTime Derby Tool
- VectorVest Simulator
- VectorVest Variator
- VectorVest Watchdog
