

HOT TOPICS LIST
- MACD
- Fibonacci
- RSI
- Gann
- ADXR
- Stochastics
- Volume
- Triangles
- Futures
- Cycles
- Volatility
- ZIGZAG
- MESA
- Retracement
- Aroon
INDICATORS LIST
LIST OF TOPICS
PRINT THIS ARTICLE
by Fawad Razaqzada
The iShares Russell 2000 (IWM), which is an exchange traded fund (ETF) seeking to track the investment results of an index composed of small-cap US equities, looks poised for a bullish breakout. But will it be successful?
Position: N/A
Fawad Razaqzada
Fawad Razaqzada is an experienced analyst and economist having been involved in the financial markets since 2010 working for leading global FX and CFD brokerages. Having graduated with a degree in economics and leveraging years of financial market experience, Fawad provides retail and professional traders worldwide with succinct fundamental & technical analysis. In addition, he also offers premium trade signals to subscribers, and trading education to help shorten the learning curves of developing traders. He has also been trading on his personal account for many years. Follow Fawad on twitter @Trader_F_R or visit his website at TradingCandles.com.
PRINT THIS ARTICLE
TECHNICAL ANALYSIS
IWM: Could US Small Caps Join The Large Cap Rally?
11/14/19 04:14:14 PMby Fawad Razaqzada
The iShares Russell 2000 (IWM), which is an exchange traded fund (ETF) seeking to track the investment results of an index composed of small-cap US equities, looks poised for a bullish breakout. But will it be successful?
Position: N/A
| US equity markets have been rallying sharply over the past few weeks amid growing speculation the US and China will agree to a phase one trade deal, which could pave the way for an eventual end to the damaging trade war. On top of this, central banks globally have been loosening their monetary policies, with the ECB and Fed restarting their debt purchases, and the latter also cutting rates again. With cheap central bank money flooding the already-saturated markets, investors have been piling into equities, especially in large-cap. As a result, we have seen new record highs for the S&P, Nasdaq and Dow. |
| However, despite the above indices breaking to new unchartered territories, the small-cap Russell 2000 index (RUT) has been unable to join the fun. Well, not yet anyway. The domestically-focused index's slight underperformance may be due to the recent slowdown in the economy. Indeed, company earnings have been falling — even for the larger caps — and businesses have been providing weakening guidance for several quarters now. Meanwhile, a select few massive large-cap stocks such as Apple and Microsoft have helped to lift the S&P and Nasdaq more disproportionally, while most other stocks have lagged. Indeed, the number of stocks above their 200-day moving average in the S&P 500 are far lower than they should be if this large-cap index was a true reflection of the US stock markets. |
| But the most important question is what happens next? Will the Russell also break to new record highs, or does its slight underperformance tell us something? Well, the chart of the iShares Russell 2000 ETF (IWM), which tracks the underling Russell 200 index, is currently right at resistance. So, we can find out soon! |
|
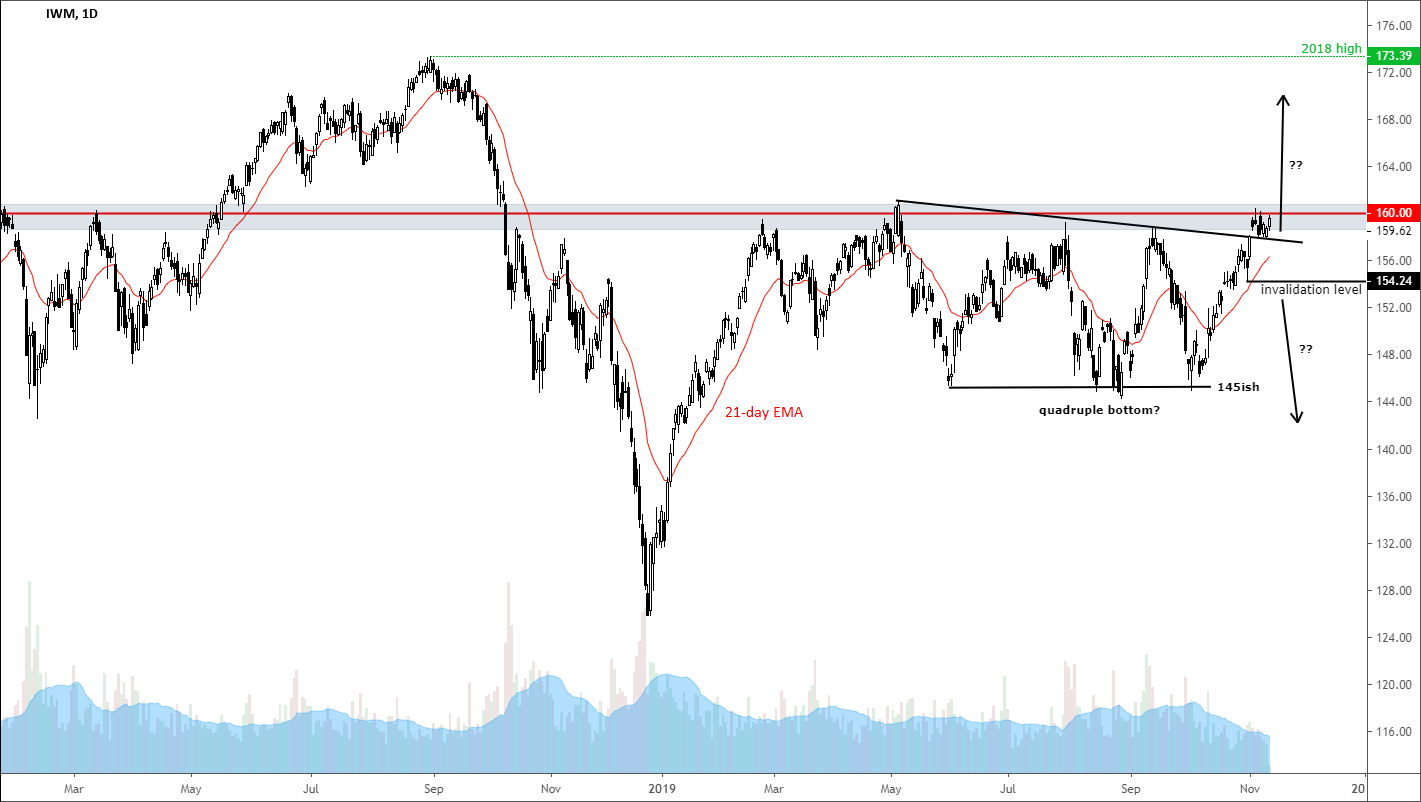
| Figure 1: The iShares Russell 2000 ETF (IWM) testing key resistance. |
| Graphic provided by: TradingView. |
| |
| Technically, the IWM has been printing higher highs and higher lows ever since the bears failed to take out key support around the 145 area at the fourth time of asking in early October. That failure resulted in the formation of a rare quadruple bottom. Fast forward a month and a half and the IWM is now trying to break through the neckline around 160ish. So, there is no question that the underlying trend has been bullish. However, the recent gains have come on the back of falling volumes, and we are yet to see the breakout above that key 160 level. Therefore, it is best to wait for price to show us the direction first. |
| Now a clean break above 160 could pave the way for further sharp gains in the short-term outlook. If this happens, there is also the possibility that it could end up moving towards the 2018 highs around 173.39 over time. Alternatively, however, in the event the IWM goes back below the most recent low of 154.24 first, then in that case this bullish idea will become invalidated. In this scenario, the IWM could go on to drop below that quadruple low of 145ish over time. The IWM provides investors exposure to smaller public US companies — 2000 of them — in a single fund. This ETF is particularly handy to those unable to trade the underlying index futures due to regulation, lack of margin or otherwise. |
Fawad Razaqzada is an experienced analyst and economist having been involved in the financial markets since 2010 working for leading global FX and CFD brokerages. Having graduated with a degree in economics and leveraging years of financial market experience, Fawad provides retail and professional traders worldwide with succinct fundamental & technical analysis. In addition, he also offers premium trade signals to subscribers, and trading education to help shorten the learning curves of developing traders. He has also been trading on his personal account for many years. Follow Fawad on twitter @Trader_F_R or visit his website at TradingCandles.com.
| Title: | Financial Market Analyst |
| Company: | TradingCandles.com |
| London, | |
| Website: | tradingcandles.com |
| E-mail address: | fawad.razaqzada@hotmail.co.uk |
Traders' Resource Links | |
| TradingCandles.com has not added any product or service information to TRADERS' RESOURCE. | |
Click here for more information about our publications!
PRINT THIS ARTICLE

Request Information From Our Sponsors
- StockCharts.com, Inc.
- Candle Patterns
- Candlestick Charting Explained
- Intermarket Technical Analysis
- John Murphy on Chart Analysis
- John Murphy's Chart Pattern Recognition
- John Murphy's Market Message
- MurphyExplainsMarketAnalysis-Intermarket Analysis
- MurphyExplainsMarketAnalysis-Visual Analysis
- StockCharts.com
- Technical Analysis of the Financial Markets
- The Visual Investor
- VectorVest, Inc.
- Executive Premier Workshop
- One-Day Options Course
- OptionsPro
- Retirement Income Workshop
- Sure-Fire Trading Systems (VectorVest, Inc.)
- Trading as a Business Workshop
- VectorVest 7 EOD
- VectorVest 7 RealTime/IntraDay
- VectorVest AutoTester
- VectorVest Educational Services
- VectorVest OnLine
- VectorVest Options Analyzer
- VectorVest ProGraphics v6.0
- VectorVest ProTrader 7
- VectorVest RealTime Derby Tool
- VectorVest Simulator
- VectorVest Variator
- VectorVest Watchdog