HOT TOPICS LIST
- MACD
- Fibonacci
- RSI
- Gann
- ADXR
- Stochastics
- Volume
- Triangles
- Futures
- Cycles
- Volatility
- ZIGZAG
- MESA
- Retracement
- Aroon
INDICATORS LIST
LIST OF TOPICS
PRINT THIS ARTICLE
by Fawad Razaqzada
The chart of Twitter is showing a potential bullish continuation pattern ahead of the company's quarterly earnings results.
Position: N/A
Fawad Razaqzada
Fawad Razaqzada is an experienced analyst and economist having been involved in the financial markets since 2010 working for leading global FX and CFD brokerages. Having graduated with a degree in economics and leveraging years of financial market experience, Fawad provides retail and professional traders worldwide with succinct fundamental & technical analysis. In addition, he also offers premium trade signals to subscribers, and trading education to help shorten the learning curves of developing traders. He has also been trading on his personal account for many years. Follow Fawad on twitter @Trader_F_R or visit his website at TradingCandles.com.
PRINT THIS ARTICLE
Tweet This: TWTR Is Bull Flagging
10/17/19 04:17:02 PMby Fawad Razaqzada
The chart of Twitter is showing a potential bullish continuation pattern ahead of the company's quarterly earnings results.
Position: N/A
| Twitter's previous earnings release was on July 26, when it delivered a big surprise with an EPS of $1.43, when just 8 cents per share was expected. The news caused TWTR to gap higher before it went on to make a new high for the year at $45.86 in early September. Since then, though, the stock has been falling back and almost entirely filled that earnings gap, ahead of its next quarterly results on October 28. |
| This time, once again investors are expecting a meager 9 cents per share profit. But with Donald Trump's activity on Twitter increasing sharply over the past months, there is a good chance its active monthly users have increased rapidly. So, could the social media company once again trounce expectations? |

|
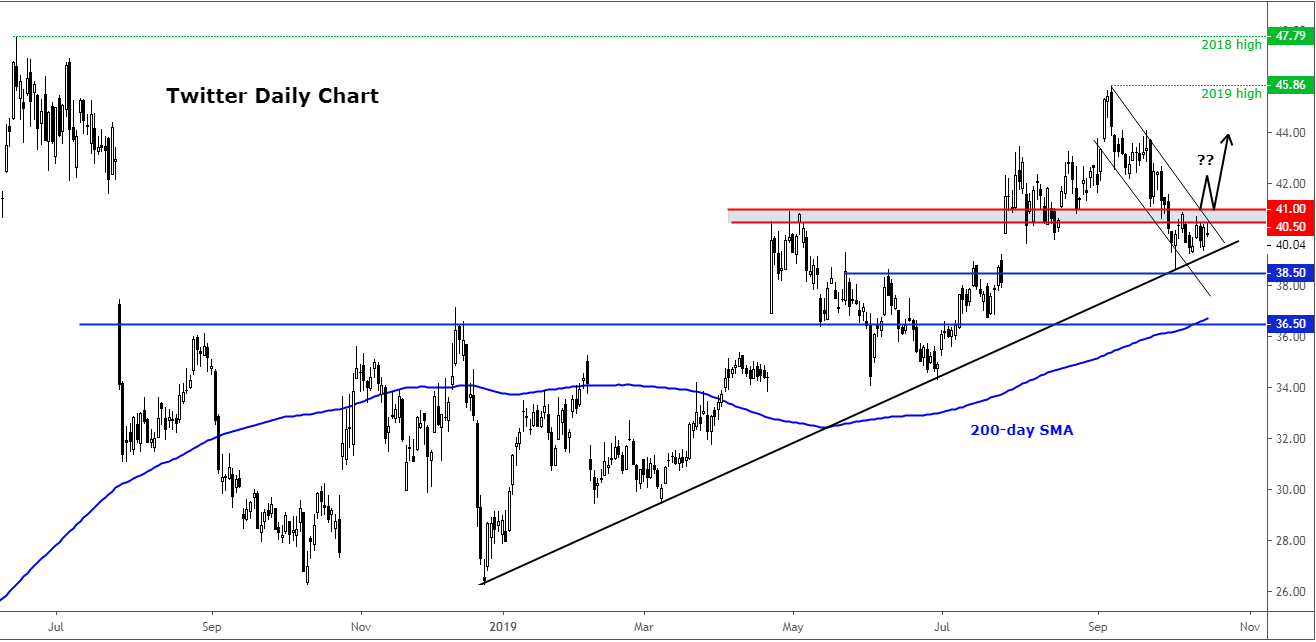
| Figure 1. Daily chaart for TWTR. |
| Graphic provided by: TradingView. |
| |
| From a technical point of view, Twitter is currently trending lower inside a bull flag. It has bounced a little from its medium-term bullish trend line around the $38-$40 area. If the stock breaks and holds above the bull flag and resistance in the $40.50-$41.00 area, then that could clear the way for a potential rally towards this year's high at $45.86, or possibly even last year's peak around $47.79. |
| Conversely, if the stock breaks the bullish trend then a return to the 200-day moving average could not be ruled out. |
| Overall, with the stock price making longer-term higher highs and higher lows, the path of least resistance is still arguably to the upside, despite its recent short-term losses. So I would prefer looking for bullish patterns to emerge as it tests key support levels, rather than bearish patterns. |
Fawad Razaqzada is an experienced analyst and economist having been involved in the financial markets since 2010 working for leading global FX and CFD brokerages. Having graduated with a degree in economics and leveraging years of financial market experience, Fawad provides retail and professional traders worldwide with succinct fundamental & technical analysis. In addition, he also offers premium trade signals to subscribers, and trading education to help shorten the learning curves of developing traders. He has also been trading on his personal account for many years. Follow Fawad on twitter @Trader_F_R or visit his website at TradingCandles.com.
| Title: | Financial Market Analyst |
| Company: | TradingCandles.com |
| London, | |
| Website: | tradingcandles.com |
| E-mail address: | fawad.razaqzada@hotmail.co.uk |
Traders' Resource Links | |
| TradingCandles.com has not added any product or service information to TRADERS' RESOURCE. | |
Click here for more information about our publications!
PRINT THIS ARTICLE

|

Request Information From Our Sponsors
- StockCharts.com, Inc.
- Candle Patterns
- Candlestick Charting Explained
- Intermarket Technical Analysis
- John Murphy on Chart Analysis
- John Murphy's Chart Pattern Recognition
- John Murphy's Market Message
- MurphyExplainsMarketAnalysis-Intermarket Analysis
- MurphyExplainsMarketAnalysis-Visual Analysis
- StockCharts.com
- Technical Analysis of the Financial Markets
- The Visual Investor
- VectorVest, Inc.
- Executive Premier Workshop
- One-Day Options Course
- OptionsPro
- Retirement Income Workshop
- Sure-Fire Trading Systems (VectorVest, Inc.)
- Trading as a Business Workshop
- VectorVest 7 EOD
- VectorVest 7 RealTime/IntraDay
- VectorVest AutoTester
- VectorVest Educational Services
- VectorVest OnLine
- VectorVest Options Analyzer
- VectorVest ProGraphics v6.0
- VectorVest ProTrader 7
- VectorVest RealTime Derby Tool
- VectorVest Simulator
- VectorVest Variator
- VectorVest Watchdog
