

HOT TOPICS LIST
- MACD
- Fibonacci
- RSI
- Gann
- ADXR
- Stochastics
- Volume
- Triangles
- Futures
- Cycles
- Volatility
- ZIGZAG
- MESA
- Retracement
- Aroon
INDICATORS LIST
LIST OF TOPICS
PRINT THIS ARTICLE
by Stella Osoba, CMT
Gravity Co., Ltd. (GRVY) is a developer, publisher and distributor of online games with its headquarters in South Korea. It was established in 2000 and its shares, which had been in an uptrend until a few months ago, were hit by a sudden bout of gravity, forcing them to take a long painful plunge. So what's next for the stock?
Position: N/A
Stella Osoba, CMT
Stella Osoba is a trader and financial writer. She is a frequent contributor to "Technical Analysis of Stocks and Commodities" magazine and "Traders.com Advantage" as well as other financial publications.
PRINT THIS ARTICLE
TECHNICAL ANALYSIS
Gravity Catches Up With GRVT
10/15/19 06:09:33 PMby Stella Osoba, CMT
Gravity Co., Ltd. (GRVY) is a developer, publisher and distributor of online games with its headquarters in South Korea. It was established in 2000 and its shares, which had been in an uptrend until a few months ago, were hit by a sudden bout of gravity, forcing them to take a long painful plunge. So what's next for the stock?
Position: N/A
| GRVY is a maker of the so-called "massively multiplayer online role playing games". Its market capitalization as of September 27, 2019 was $119 million making it a micro cap. As a micro cap with very little institutional investor participation, this stock might present more risk than other more established large players, but as the performance of its stock price has shown, when it does move, it can expose its holders to impressive gains or losses in either direction. |
|
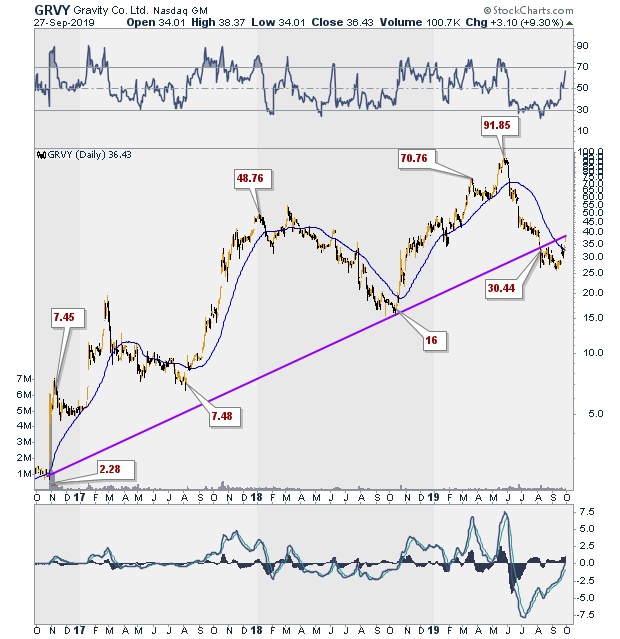
| Figure 1. 3-year GRVY Daily Chart. |
| Graphic provided by: StockCharts.com. |
| |
| Figure 1 shows a daily three year chart of GRVY. We can see that despite wide swings, it was generally in an impressive uptrend during much of that time. From a close of $2.23 in October 2016, the stock went on to notch significant gains, closing at a high of $91.85 in May of 2019. But nothing lasts forever — the stock hit overhead resistance in May of 2019 and took a dive, breaking its uptrend line. |
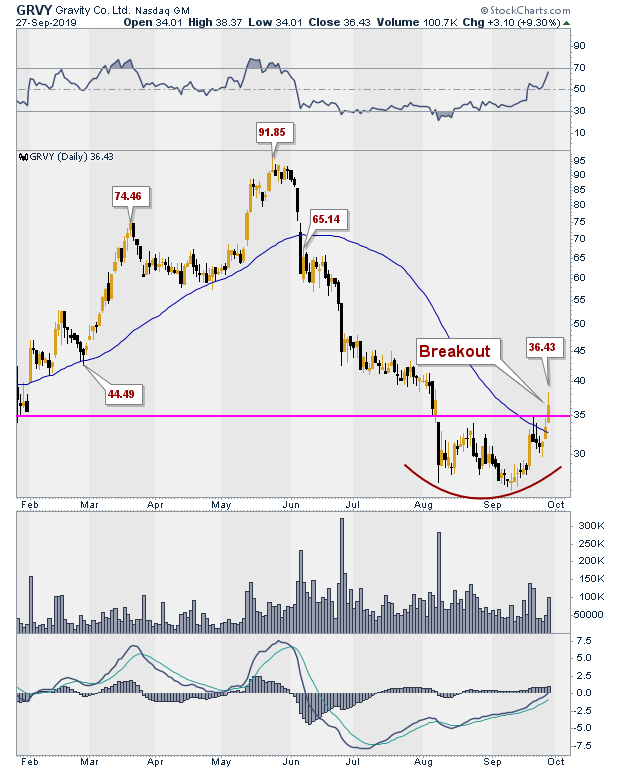
| Figure 2 is a closer look at the daily price action of the stock. Its fall was steep and sudden and it was also likely to catch many investors who had been used to its impressive returns unaware. There was no definitive signal to alert one to the coming change in trend. There was no divergence with price and the MACD or RSI. There was no way to know that this was anything other than another reaction in GRVY's continued journey to the skies. The disciplined trader would have had rules governing behavior. One such could have been a decisive break of the 50-day moving average, or its failure to test the 50-day when it moved below it as a signal to reduce longs or exit. Anyway, the trend was broken and those left holding the stock were likely holding on to mounting losses. |
|
| Figure 2. GRVY Daily Chart. |
| Graphic provided by: StockCharts.com. |
| |
| After a deep plunge on August 8, 2019, the stock seemed to meet support. Supply was spent for the time being at least, and buyers began to reappear. The stock was range bound for the next two months and then on September 27, 2019, it broke upwards out of the trading range in classic technical fashion (see Figure 2). Volume on the day of breakout was two times the volume on the prior day. The only negative was that the breakout bullish candlestick had a long upper tail which meant it had closed off its highs as holders took advantage of the strong price action to exit their positions. But the closing price was still above halfway of the day's range which is positive. Also, as the stock found support, the MACD and RSI were showing positive divergence. |
| Watch the stock to see how its share price performs over the coming weeks and months. As a micro cap, its moves to the up- or down-side can be sudden and impressive as big players can move in without notice to push the stock price around. But watch for the trend — are its current moves part of a reaction or reversal? That is the question you want to answer. |
Stella Osoba is a trader and financial writer. She is a frequent contributor to "Technical Analysis of Stocks and Commodities" magazine and "Traders.com Advantage" as well as other financial publications.
| E-mail address: | stellaosoba@gmail.com |
Click here for more information about our publications!
PRINT THIS ARTICLE

Request Information From Our Sponsors
- StockCharts.com, Inc.
- Candle Patterns
- Candlestick Charting Explained
- Intermarket Technical Analysis
- John Murphy on Chart Analysis
- John Murphy's Chart Pattern Recognition
- John Murphy's Market Message
- MurphyExplainsMarketAnalysis-Intermarket Analysis
- MurphyExplainsMarketAnalysis-Visual Analysis
- StockCharts.com
- Technical Analysis of the Financial Markets
- The Visual Investor
- VectorVest, Inc.
- Executive Premier Workshop
- One-Day Options Course
- OptionsPro
- Retirement Income Workshop
- Sure-Fire Trading Systems (VectorVest, Inc.)
- Trading as a Business Workshop
- VectorVest 7 EOD
- VectorVest 7 RealTime/IntraDay
- VectorVest AutoTester
- VectorVest Educational Services
- VectorVest OnLine
- VectorVest Options Analyzer
- VectorVest ProGraphics v6.0
- VectorVest ProTrader 7
- VectorVest RealTime Derby Tool
- VectorVest Simulator
- VectorVest Variator
- VectorVest Watchdog