

HOT TOPICS LIST
- MACD
- Fibonacci
- RSI
- Gann
- ADXR
- Stochastics
- Volume
- Triangles
- Futures
- Cycles
- Volatility
- ZIGZAG
- MESA
- Retracement
- Aroon
INDICATORS LIST
LIST OF TOPICS
PRINT THIS ARTICLE
by Fawad Razaqzada
Apple is set to break out from a technically important area, but in which direction?
Position: N/A
Fawad Razaqzada
Fawad Razaqzada is an experienced analyst and economist having been involved in the financial markets since 2010 working for leading global FX and CFD brokerages. Having graduated with a degree in economics and leveraging years of financial market experience, Fawad provides retail and professional traders worldwide with succinct fundamental & technical analysis. In addition, he also offers premium trade signals to subscribers, and trading education to help shorten the learning curves of developing traders. He has also been trading on his personal account for many years. Follow Fawad on twitter @Trader_F_R or visit his website at TradingCandles.com.
PRINT THIS ARTICLE
Apple Poised For Sharp Move As Investors Weigh Conflicting Macro Forces
10/08/19 06:13:35 PMby Fawad Razaqzada
Apple is set to break out from a technically important area, but in which direction?
Position: N/A
| The chart of the Apple is an interesting one to watch as it hovers around a technically important area as investors weigh conflicting macro forces driving sentiment. Apple bulls would point to the fact that the stock has been consolidating near its recent highs over the past few weeks, allowing its short-term oscillators to work off their "overbought" conditions through time rather than price, which is considered to be technically bullish. Similarly, the major US indices have been able to absorb lots of negative news such as Trump's impeachment inquiry and weak macroeconomic pointers from around the world, and so on. Thus, the markets apparently "feel" strong and could mean new record highs soon, especially since many central bank speakers have come out in support of more monetary stimulus. |
| However, with so much macro uncertainty out there and with the Chinese economy being bruised because of the US tariffs, this may point to subdued demand for Apple's products from the world's second largest economy. So, the bears have an equal shout here — hence why the stock has been struggling to make a clean move in one or the other direction. But soon it will break out, and depending on the direction of the break, we could see a sharp move in that direction. Thus, both the bulls and bears may want to watch Apple's price action closely in the coming days as the stock attempts to break out of its pennant consolidation pattern. |
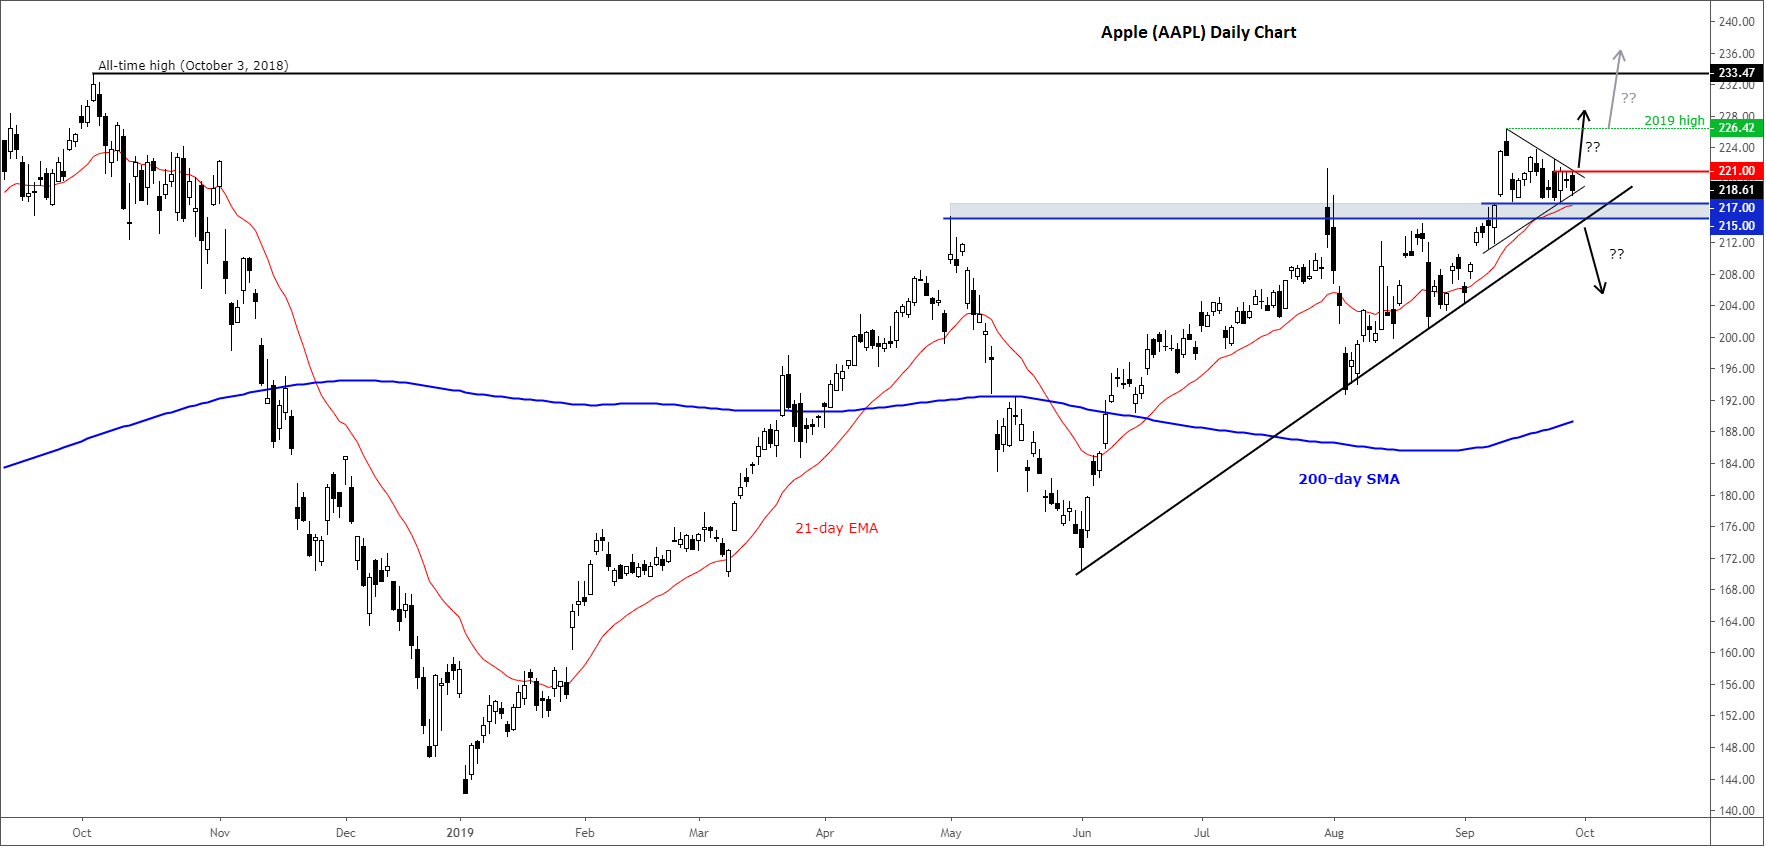
| A break to the upside above short-term resistance at $221 could trigger fresh buying momentum towards this year's high of $226.42, and possibly the all-time high from last year (at $233.47). However, a break lower below key support in the $215-$217 range (where we also have the 21-day exponential moving average and the bullish trend line converging) could see the bulls rush for the exits. |
| Out of the two scenarios, I would favor the bullish case because of the fact the longer-term trend has been bullish. But just because that is what I prefer does not mean it will happen. So, conservative bullish traders should wait for the correct signal to emerge before jumping on board. For me, as mentioned, the trigger is a daily close above $221.00 resistance. |
|
| Figure 1. Daily Chart for AAPL. |
| Graphic provided by: TradingView. |
| |
Fawad Razaqzada is an experienced analyst and economist having been involved in the financial markets since 2010 working for leading global FX and CFD brokerages. Having graduated with a degree in economics and leveraging years of financial market experience, Fawad provides retail and professional traders worldwide with succinct fundamental & technical analysis. In addition, he also offers premium trade signals to subscribers, and trading education to help shorten the learning curves of developing traders. He has also been trading on his personal account for many years. Follow Fawad on twitter @Trader_F_R or visit his website at TradingCandles.com.
| Title: | Financial Market Analyst |
| Company: | TradingCandles.com |
| London, | |
| Website: | tradingcandles.com |
| E-mail address: | fawad.razaqzada@hotmail.co.uk |
Traders' Resource Links | |
| TradingCandles.com has not added any product or service information to TRADERS' RESOURCE. | |
Click here for more information about our publications!
PRINT THIS ARTICLE

Request Information From Our Sponsors
- StockCharts.com, Inc.
- Candle Patterns
- Candlestick Charting Explained
- Intermarket Technical Analysis
- John Murphy on Chart Analysis
- John Murphy's Chart Pattern Recognition
- John Murphy's Market Message
- MurphyExplainsMarketAnalysis-Intermarket Analysis
- MurphyExplainsMarketAnalysis-Visual Analysis
- StockCharts.com
- Technical Analysis of the Financial Markets
- The Visual Investor
- VectorVest, Inc.
- Executive Premier Workshop
- One-Day Options Course
- OptionsPro
- Retirement Income Workshop
- Sure-Fire Trading Systems (VectorVest, Inc.)
- Trading as a Business Workshop
- VectorVest 7 EOD
- VectorVest 7 RealTime/IntraDay
- VectorVest AutoTester
- VectorVest Educational Services
- VectorVest OnLine
- VectorVest Options Analyzer
- VectorVest ProGraphics v6.0
- VectorVest ProTrader 7
- VectorVest RealTime Derby Tool
- VectorVest Simulator
- VectorVest Variator
- VectorVest Watchdog