

HOT TOPICS LIST
- MACD
- Fibonacci
- RSI
- Gann
- ADXR
- Stochastics
- Volume
- Triangles
- Futures
- Cycles
- Volatility
- ZIGZAG
- MESA
- Retracement
- Aroon
INDICATORS LIST
LIST OF TOPICS
PRINT THIS ARTICLE
by Stella Osoba, CMT
A bear trap is a bullish signal, so recognizing them and understanding how to trade them can be very useful. To illustrate the classic bear trap, we shall use Facebook (FB) which recently completed one.
Position: N/A
Stella Osoba, CMT
Stella Osoba is a trader and financial writer. She is a frequent contributor to "Technical Analysis of Stocks and Commodities" magazine and "Traders.com Advantage" as well as other financial publications.
PRINT THIS ARTICLE
POINT & FIGURE
Bear Traps In Point And Figure
09/26/19 04:32:51 PMby Stella Osoba, CMT
A bear trap is a bullish signal, so recognizing them and understanding how to trade them can be very useful. To illustrate the classic bear trap, we shall use Facebook (FB) which recently completed one.
Position: N/A
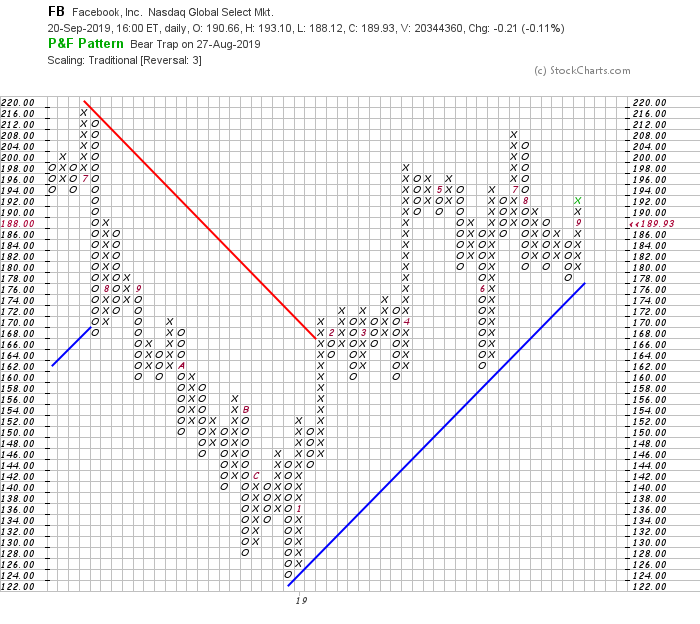
| Point and Figure signals happen when a breakout or a breakdown happens. The most basic signal is a double top breakout or a double bottom breakdown. The double top breakout occurs when an X column breaks above the high of the prior X column. The two columns will be separated by a column of Os. The double bottom breakdown occurs when a column of Os breaks below the prior column of Os. In this case, the column separating the two columns of Os will be a column of Xs. |
| When a double bottom breakdown occurs, the signal is bearish because in Point and Figure this counts as a sell signal. But if, instead of price continuing lower, it reverses and forms a column of Xs, then a bear trap has occurred. The Os must be one box lower than the prior column of Os. Anything more, negates the signal (See Figure 1). The column of Os before the last column of Xs on the right of the chart has broken one box below the column of Os immediately prior and then a reversal happens to the upside. |
|
| Figure 1. Point and Figure chart for FB. |
| Graphic provided by: StockCharts.com. |
| |
| Caution should be taken when attempting to trade bear traps from signals generated in Point and Figure charts because they are often not very robust since the reversal is only by one box. It is very possible for a catapult to form if the next column of Os breaks below the prior column of Os. It will therefore negate the bear trap. |
| A bear trap is exactly what the name implies it is; a trap, and there is no easy way to trade them. Without the benefit of hindsight, we cannot know when the second column of O's form that a reversal to the upside will next occur. If we are trading Point and Figure signals then we may have to take the sell signal and wait until a buy signal has occurred before exiting the position. In Figure 1 we can see that a bullish signal occurred when the most recent column of Xs closed above the prior column of Xs. |
|
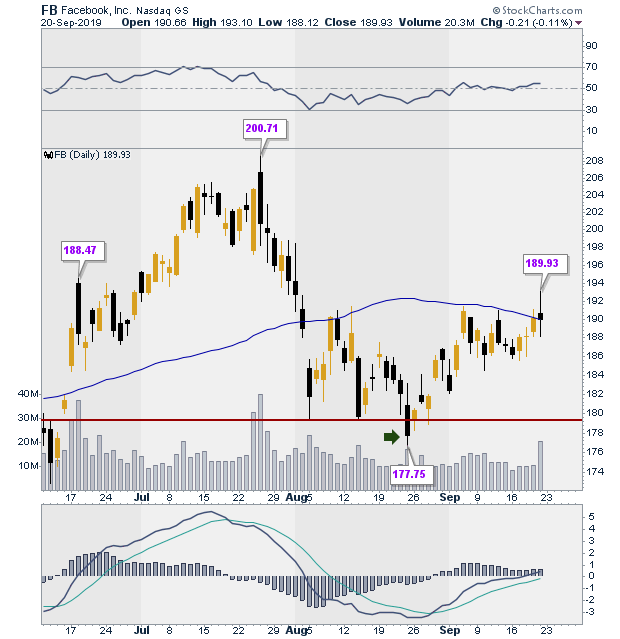
| Figure 2. Daily chart for FB. |
| Graphic provided by: StockCharts.com. |
| |
| If we look at Figure 2 which is a candlestick daily chart depicting the time period during which the bull trap happens we can see that the bull trap occurs when price breaks below the two prior lows on the chart (see green arrow). Price then reverses back above support and continues higher, finding resistance at the 50-day moving average. Looking at the candlestick chart for confirmation of the signals produced in the Point and Figure charts will show that the signals are weak. Price is rising but not very convincingly. Maybe this is a situation where it would be best to watch price action unfold for more information before initiating a position, if at all. When trading, it is often best to trade on only the strongest signals and wait for all the stars to be aligned. This requires discipline and patience. |
Stella Osoba is a trader and financial writer. She is a frequent contributor to "Technical Analysis of Stocks and Commodities" magazine and "Traders.com Advantage" as well as other financial publications.
| E-mail address: | stellaosoba@gmail.com |
Click here for more information about our publications!
Comments
Date:�09/28/19Rank:�4Comment:�
Date:�09/28/19Rank:�5Comment:�

Request Information From Our Sponsors
- StockCharts.com, Inc.
- Candle Patterns
- Candlestick Charting Explained
- Intermarket Technical Analysis
- John Murphy on Chart Analysis
- John Murphy's Chart Pattern Recognition
- John Murphy's Market Message
- MurphyExplainsMarketAnalysis-Intermarket Analysis
- MurphyExplainsMarketAnalysis-Visual Analysis
- StockCharts.com
- Technical Analysis of the Financial Markets
- The Visual Investor
- VectorVest, Inc.
- Executive Premier Workshop
- One-Day Options Course
- OptionsPro
- Retirement Income Workshop
- Sure-Fire Trading Systems (VectorVest, Inc.)
- Trading as a Business Workshop
- VectorVest 7 EOD
- VectorVest 7 RealTime/IntraDay
- VectorVest AutoTester
- VectorVest Educational Services
- VectorVest OnLine
- VectorVest Options Analyzer
- VectorVest ProGraphics v6.0
- VectorVest ProTrader 7
- VectorVest RealTime Derby Tool
- VectorVest Simulator
- VectorVest Variator
- VectorVest Watchdog