

HOT TOPICS LIST
- MACD
- Fibonacci
- RSI
- Gann
- ADXR
- Stochastics
- Volume
- Triangles
- Futures
- Cycles
- Volatility
- ZIGZAG
- MESA
- Retracement
- Aroon
INDICATORS LIST
LIST OF TOPICS
PRINT THIS ARTICLE
by Mark Rivest
Discovering the optimum time to short a bottom or buy a top.
Position: N/A
Mark Rivest
Independent investment advisor, trader and writer. He has written articles for Technical Analysis of Stocks & Commodities, Traders.com Advantage,Futuresmag.com and, Finance Magnates. Author of website Four Dimension Trading.
PRINT THIS ARTICLE
BREAKOUTS
Trading Breakouts
09/12/19 04:24:37 PMby Mark Rivest
Discovering the optimum time to short a bottom or buy a top.
Position: N/A
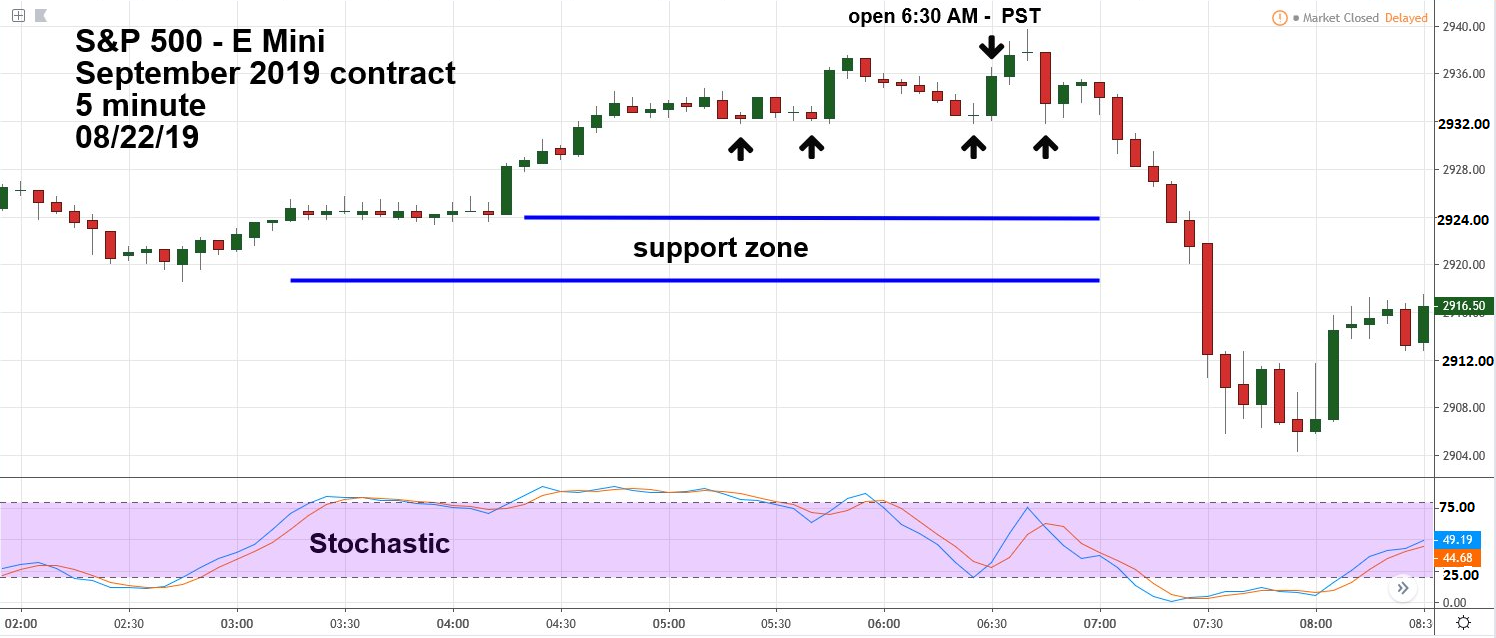
| It could be difficult to initiate a short at the low point of a down move or to go long the top tick. You could be selling/buying at the exhaustion point of the move. Even if you're correct on direction, a small counter trend movement could trigger a stop out. Fortunately, there are price patterns which could help to increase the chances of a profitable breakout trade. S&P 500 - E Mini 5-minute The main characteristics to watch for in a breakout trade: at least two tops/bottoms at the same or very near price, no support zones immediately below the breakout point or resistance above a breakout point. Please see the S&P 500 - E Mini September 2019 futures (ESU19) 5-minute chart illustrated in Figure 1. It's easier to spot breakout points using Candle charts. During the overnight session of August 22, 2019 there were several bottoms at or very near the price of 2931.75. This price level was tested again just after the main trading session began at 6:30 AM PST/9:30 AM EST. Note that just below 2931.75 there are no significant support levels until around the 2924.00 area. If a stop sell order is placed at 2931.50 just below the breakout point, there's potential for a quick trade down to at least 2925.50. A six point move for one S&P 500 - E Mini contract equals $300.00. Stochastic is a good indicator in finding a potentially profitable breakout. For breakout moves that could only travel for 15 minutes or less use 5-minute charts. At this scale, most of the time both the fast and slow Stochastic lines will be in the neutral zone between 20% and 80%. If both lines subsequently reach deep in the oversold zone it could be a signal to exit the short position. Placement of stop loss orders after a breakout trade has been filled vary depending on the price structure just prior to the breakout. In this situation there was a small rally peak at 2935.50 just before the move below 2931.75. The stop buy order could be placed at 2935.75 resulting in a loss of four points or more. This might be too wide for some S&P 500 - E Mini traders, an alternate stop target could be placed above the high of the breakout's 5-minute candle at 2934.50. |
|
| Figure 1. It's easier to spot break out points using Candle charts. |
| Graphic provided by: TradingView. |
| |
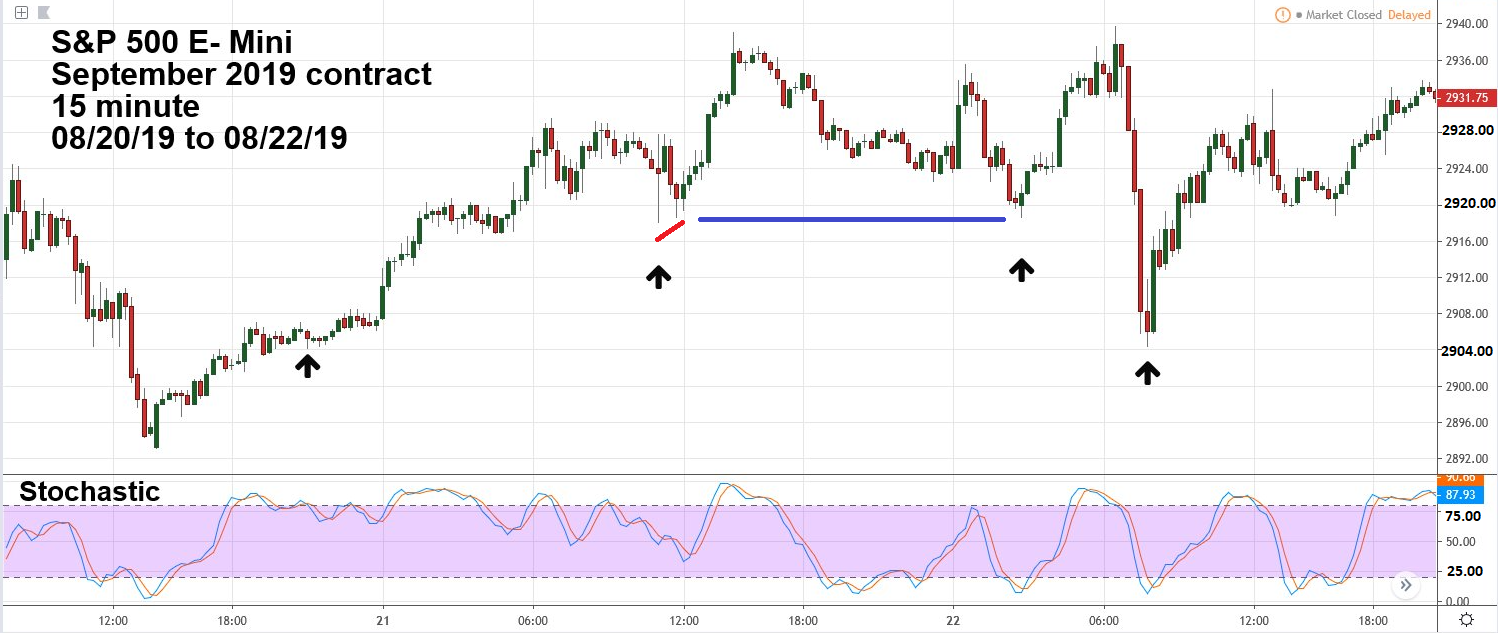
| S&P 500 - E Mini 15-minute Expanding the time scale for the breakout made on August 22, 2019 illustrates the ultimate result. Please see the S&P 500 - E Mini September 2019 futures 15-minute chart illustrated in Figure 2. In most situations after a downside breakout, a market will gravitate to the next significant support level; in this case the overnight session bottom at 2918.50. However, note that this is also a double bottom matching the bottom made in the prior main trading day session at 2918.00. Traders could have made a second downside breakout trade on August 22 at 1917.75. Note that there's prior chart support during the August 21 overnight session. An alternate breakout short trade could have been placed at 2916.50 just below the overnight session correction bottom. Both lines of the 15-minute Stochastic are in the neutral zone at the breakout points. The powerful one-hour opening smash down of August 22 finally bottomed at 2904.25, just one tick above an overnight correction low at 2904.00 with both lines of the 15-minute Stochastic deep in the oversold zone. |
|
| Figure 2. Both lines of the 15-minute Stochastic are in the neutral zone at the breakout points. |
| Graphic provided by: TradingView. |
| |
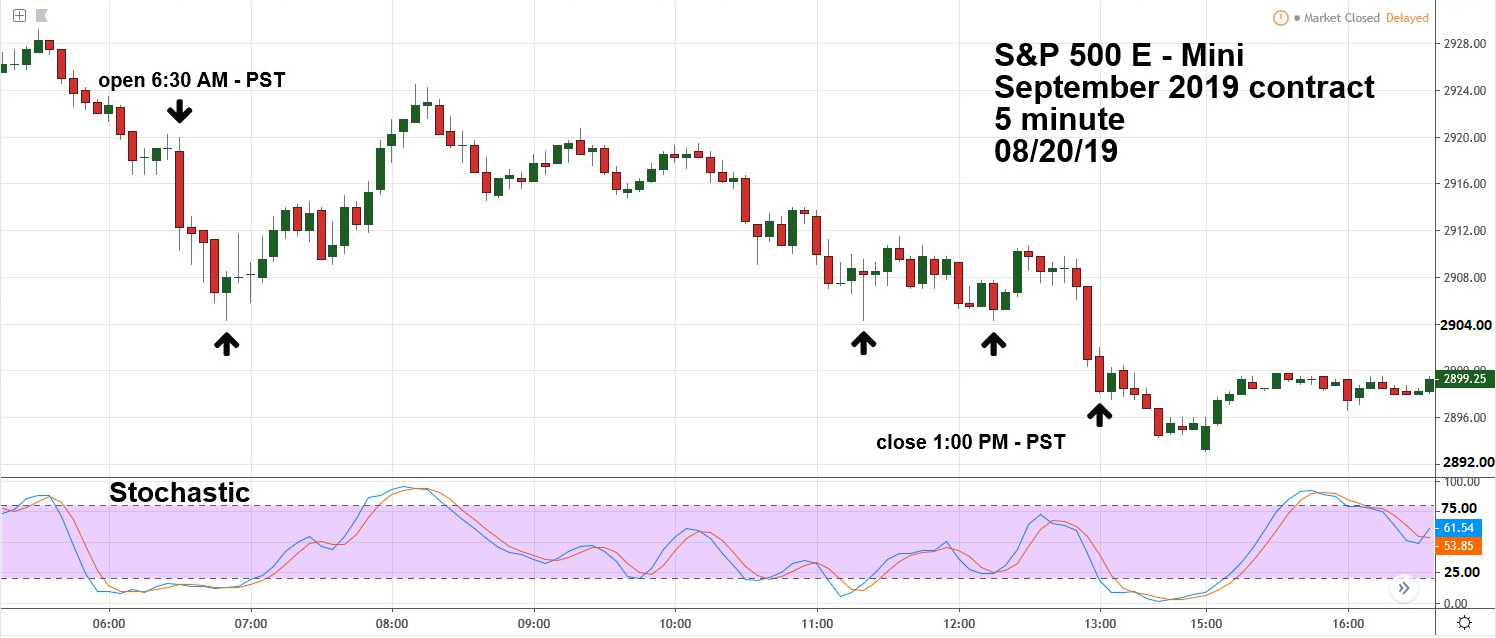
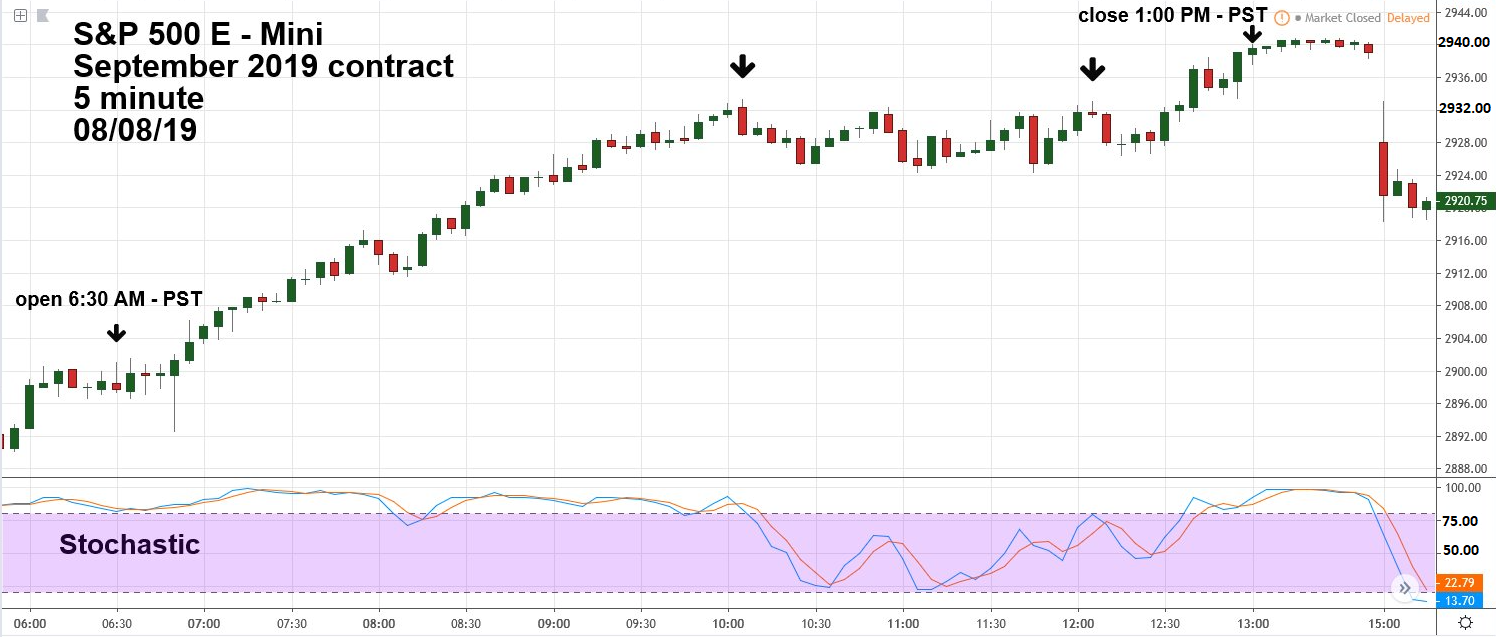
| Late Day Breakout Opportunities Please see the S&P 500 - E Mini September 2019 futures 5-minute chart for August 20, 2019 illustrated in Figure 3. For most of the main day trading session the trend was down. Perhaps you've missed every opportunity to establish a short position. If so, there could be one last chance just before the S&P 500 (SPX) session ends at 4:00 PM EST/1:00 PM PST. Sometimes near the end of a session there could be one last surge of the main session trend. Most likely, large traders such as funds still have positions to sell or buy, they need the liquidity provided by the main SPX trading session to execute positions. Waiting until the overnight session may not be an option because low liquidity will likely cause them to have trades executed at less advantageous prices than during the main session. Waiting until the next main trading day session could be an even worse option as a market trending down could open significantly lower than the prior day session. Therefore, you could have one last opportunity near the end of the main trading session. Note the triple bottom made at 2904.25 throughout the main session. A stop sell order placed at 2904.00 could potentially earn up to six points profit within the last five minutes of the August 20 SPX main trading session. Note again both lines of the 5-minute Stochastic are within the neutral zone at the breakout point. Please see the 5-minute S&P 500 E Mini chart for August 8, 2019 illustrated in Figure 4. This is an example of late main session short covering. Note the tops at 2933.25 and at 2933.00. A stop buy at 2933.50 could have yielded a profit of up to six points if held to the close of the SPX session. However, note that on the breakout only one Stochastic line is in the neutral zone providing a hint that an upside breakout may lack strength, which is what happened as the final rally took about twenty minutes to complete. Typically, late session moves only last about five to ten minutes. |
|
| Figure 3. Note the triple bottom made at 2904.25 throughout the main session. |
| Graphic provided by: TradingView. |
| |
| Breakouts Are For Everyone What if you're not a day trader? Because of the fractal nature of markets, patterns that appear on an intraday level also occur on longer time scales. Breakout opportunities develop on daily, weekly and monthly charts for all markets and individual stocks. Do all breakouts develop into profit opportunities? No. Some breakouts are false and quickly reverse, and as already noted it's possible to be stopped out and still have the breakout continue in the expected direction. Learning to deal with these occasional disappointments are part of the process of becoming a proficient trader. |
|
| Figure 4. This is an example of late main session short covering. |
| Graphic provided by: TradingView. |
| |
Independent investment advisor, trader and writer. He has written articles for Technical Analysis of Stocks & Commodities, Traders.com Advantage,Futuresmag.com and, Finance Magnates. Author of website Four Dimension Trading.
| Website: | www.fourdimensiontrading.com |
| E-mail address: | markrivest@gmail.com |
Click here for more information about our publications!
Comments
Date:�09/24/19Rank:�5Comment:�

Request Information From Our Sponsors
- VectorVest, Inc.
- Executive Premier Workshop
- One-Day Options Course
- OptionsPro
- Retirement Income Workshop
- Sure-Fire Trading Systems (VectorVest, Inc.)
- Trading as a Business Workshop
- VectorVest 7 EOD
- VectorVest 7 RealTime/IntraDay
- VectorVest AutoTester
- VectorVest Educational Services
- VectorVest OnLine
- VectorVest Options Analyzer
- VectorVest ProGraphics v6.0
- VectorVest ProTrader 7
- VectorVest RealTime Derby Tool
- VectorVest Simulator
- VectorVest Variator
- VectorVest Watchdog
- StockCharts.com, Inc.
- Candle Patterns
- Candlestick Charting Explained
- Intermarket Technical Analysis
- John Murphy on Chart Analysis
- John Murphy's Chart Pattern Recognition
- John Murphy's Market Message
- MurphyExplainsMarketAnalysis-Intermarket Analysis
- MurphyExplainsMarketAnalysis-Visual Analysis
- StockCharts.com
- Technical Analysis of the Financial Markets
- The Visual Investor