

HOT TOPICS LIST
- MACD
- Fibonacci
- RSI
- Gann
- ADXR
- Stochastics
- Volume
- Triangles
- Futures
- Cycles
- Volatility
- ZIGZAG
- MESA
- Retracement
- Aroon
INDICATORS LIST
LIST OF TOPICS
PRINT THIS ARTICLE
by Stella Osoba, CMT
During the summer in Pamplona, Spain, there is a festival known locally as the San Fermin festival. The highlight of this festival is the Encierro, or running of the bulls. The running of the bulls involves running in front of about six, sometimes ten cattle which have been let loose on a sectioned off part of the town's streets. If you choose to participate in this highly risky endeavor you must know what you are doing. This requirement is not dissimilar to stock trading.
Position: N/A
Stella Osoba, CMT
Stella Osoba is a trader and financial writer. She is a frequent contributor to "Technical Analysis of Stocks and Commodities" magazine and "Traders.com Advantage" as well as other financial publications.
PRINT THIS ARTICLE
TECHNICAL ANALYSIS
It Can Always Go Lower
09/12/19 04:04:36 PMby Stella Osoba, CMT
During the summer in Pamplona, Spain, there is a festival known locally as the San Fermin festival. The highlight of this festival is the Encierro, or running of the bulls. The running of the bulls involves running in front of about six, sometimes ten cattle which have been let loose on a sectioned off part of the town's streets. If you choose to participate in this highly risky endeavor you must know what you are doing. This requirement is not dissimilar to stock trading.
Position: N/A
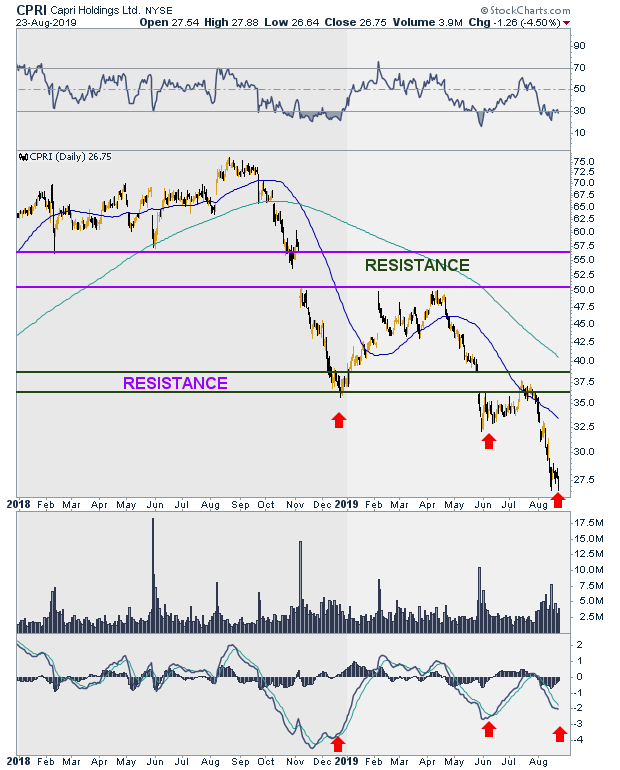
| Capri Holdings Ltd. (CPRI) is in a clear downtrend (See Figure 1). It has been in a downtrend since the fourth quarter of 2018. Looking at this chart with its clear downtrend, it is tempting to look for opportunities to go long. The rationale might be that the downtrend is already well advanced. Sometimes, the urge to be contrarian causes traders, often newer traders, to look for signs others do not see. In an uptrend they might look for reasons to short stocks and vice versa in a downtrend. The more successful trade should be the less obvious one, they reason. But that is not always the case. |
|
| Figure 1. Daily Chart For CPRI. |
| Graphic provided by: StockCharts.com. |
| |
| If we take a closer look at Figure 1, the red arrows on the chart show positive divergence with the MACD. Price is making lower lows but the MACD is not confirming, it is making higher lows. This could, at first glance, be a reason to suspect that price is about to reverse and convince the trader to take the long side of the trade. But this rationale, without more, can be a costly mistake. After all, another glance at the chart will show that the first noticeable positive divergence was in June of 2019, but price eventually broke lower. All divergence is, is a slowing or speeding up of momentum or the speed of price change. It can be a supporting indicator, hinting at a coming reversal, but confirmation must come from price. |
| It is important when looking at charts to not allow ourselves to pre-empt signals on the charts. Yes, downtrends eventually resolve. Yes, shares that are trading at 52-week lows may eventually reverse to the upside, but when and how they will is not something we can guess at with any measure of success. As technicians we must trust the charts and exercise the discipline that allows us not to substitute our judgment for that of the market. We must read the charts and see the signals that are actually on the charts not those we anticipate will soon appear. |
| In this case, the negative signals overwhelm the positive ones. The 200-day moving average is above the 50-day moving average and both averages are moving down. Price is in a clear downtrend and is making lower lows. Multiple gap downs forming areas of resistance, marked on the chart, are still unfilled. The most recent close shows that that low of that day is matched by the low made six trading days prior (see thumbnail). Above all, there is no reversal signal on the price chart. That price will eventually find its low is not in dispute, but when that will be is. Before rushing in to take a contrarian bet, remember that price can always go lower. |
| We all want to be contrarians but often the best trade to take is also the simplest. Either we choose to do nothing, or we run with the bulls, or in this case, the bears, not against them, to avoid getting trampled and possibly even gored. |
Stella Osoba is a trader and financial writer. She is a frequent contributor to "Technical Analysis of Stocks and Commodities" magazine and "Traders.com Advantage" as well as other financial publications.
| E-mail address: | stellaosoba@gmail.com |
Click here for more information about our publications!
PRINT THIS ARTICLE

Request Information From Our Sponsors
- VectorVest, Inc.
- Executive Premier Workshop
- One-Day Options Course
- OptionsPro
- Retirement Income Workshop
- Sure-Fire Trading Systems (VectorVest, Inc.)
- Trading as a Business Workshop
- VectorVest 7 EOD
- VectorVest 7 RealTime/IntraDay
- VectorVest AutoTester
- VectorVest Educational Services
- VectorVest OnLine
- VectorVest Options Analyzer
- VectorVest ProGraphics v6.0
- VectorVest ProTrader 7
- VectorVest RealTime Derby Tool
- VectorVest Simulator
- VectorVest Variator
- VectorVest Watchdog
- StockCharts.com, Inc.
- Candle Patterns
- Candlestick Charting Explained
- Intermarket Technical Analysis
- John Murphy on Chart Analysis
- John Murphy's Chart Pattern Recognition
- John Murphy's Market Message
- MurphyExplainsMarketAnalysis-Intermarket Analysis
- MurphyExplainsMarketAnalysis-Visual Analysis
- StockCharts.com
- Technical Analysis of the Financial Markets
- The Visual Investor