HOT TOPICS LIST
- MACD
- Fibonacci
- RSI
- Gann
- ADXR
- Stochastics
- Volume
- Triangles
- Futures
- Cycles
- Volatility
- ZIGZAG
- MESA
- Retracement
- Aroon
INDICATORS LIST
LIST OF TOPICS
PRINT THIS ARTICLE
by Andrew Hetherington
The daily chart for SBC Communications Incorporated (SBC) shows a breakout from a complex head and shoulders pattern in the $28.00 area. Are they poised for the long distance ride?
Position: N/A
Andrew Hetherington
Classic Dow Theorist who trades as a pure technician, using pattern recognition.
PRINT THIS ARTICLE
CHART ANALYSIS
Heads & Shoulders for SBC Communications
12/27/02 12:14:11 PMby Andrew Hetherington
The daily chart for SBC Communications Incorporated (SBC) shows a breakout from a complex head and shoulders pattern in the $28.00 area. Are they poised for the long distance ride?
Position: N/A
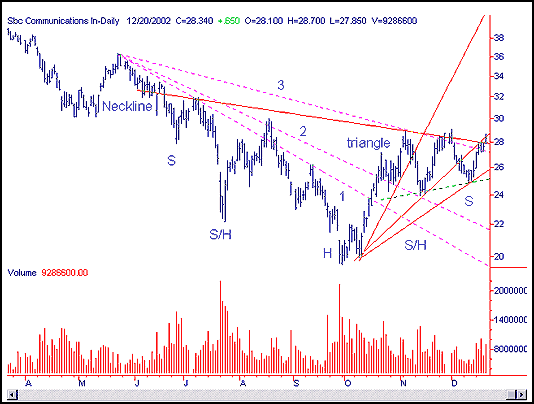
 Figure 1: Daily chart of SBC Communications. This complex head and shoulders has either multiple heads or multiple shoulders, depending on your preference when diagnosing this pattern. My preference is three heads and two small shoulders since this interpretation leaves open the notion of symmetry of the shoulders. This symmetry I so often refer to is important to watch to help stave off disaster when trading. Another aspect to save you from making a big mistake is to watch the volume on the bottom of the head, to see if it dwindles to almost nothing. This petering out of volume on the bottom of the head gives you the confidence that you are not misdiagnosing the pattern. |
| In addition, the third fan line has been broken in the $28.00 area. This line must be broken with an increase in activity to be trusted. This temporary change in direction from down to up usually has a burst of activity and a rise in prices followed by a throwback to the line. The customary throwback normally crawls along the third fan line and drifts downward a little. Don't be alarmed at this occurrence since this is the buying opportunity. Buying a long position is always best when done during a temporary weakness from a throwback after the breakout. This is the safest style of trading although my preference is to trade within the patterns. One must be cautious when trading within patterns since they could easily go in the wrong direction since you have no confirmation with a breakout. |

|
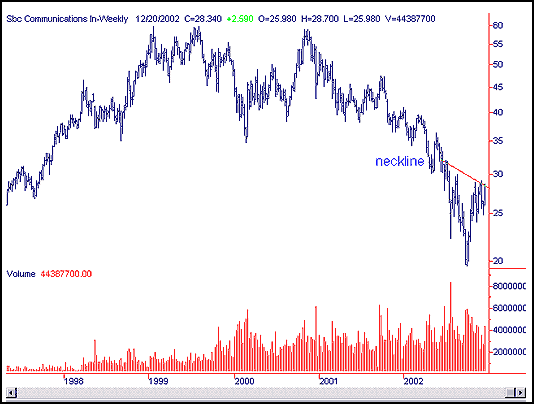
| Figure 2: Weekly chart for SBC Communications. |
| Graphic provided by: SuperCharts. |
| |
| The weekly chart shows the volume is increasing throughout the construction of the pattern with the right side illustrating diminished activity. However, overall it increases from left to right as is necessary when I chose a head and shoulders trade. |
| Finally, there is a small 2-month symmetrical triangle that has broken out today (12/20/02). This breakout shows an increase in volume and it is a safe assumption that it will climb significantly higher since both patterns have broken topside together. |
Classic Dow Theorist who trades as a pure technician, using pattern recognition.
| Toronto, Canada |
Click here for more information about our publications!
Comments
Date: 12/27/02Rank: 4Comment:
Date: 12/28/02Rank: Comment: Andrew: Would you do an article on the Dow and where you think it is going to go, thankyou, Tom
tpaulett@idmail.com

Request Information From Our Sponsors
- StockCharts.com, Inc.
- Candle Patterns
- Candlestick Charting Explained
- Intermarket Technical Analysis
- John Murphy on Chart Analysis
- John Murphy's Chart Pattern Recognition
- John Murphy's Market Message
- MurphyExplainsMarketAnalysis-Intermarket Analysis
- MurphyExplainsMarketAnalysis-Visual Analysis
- StockCharts.com
- Technical Analysis of the Financial Markets
- The Visual Investor
- VectorVest, Inc.
- Executive Premier Workshop
- One-Day Options Course
- OptionsPro
- Retirement Income Workshop
- Sure-Fire Trading Systems (VectorVest, Inc.)
- Trading as a Business Workshop
- VectorVest 7 EOD
- VectorVest 7 RealTime/IntraDay
- VectorVest AutoTester
- VectorVest Educational Services
- VectorVest OnLine
- VectorVest Options Analyzer
- VectorVest ProGraphics v6.0
- VectorVest ProTrader 7
- VectorVest RealTime Derby Tool
- VectorVest Simulator
- VectorVest Variator
- VectorVest Watchdog
