

HOT TOPICS LIST
- MACD
- Fibonacci
- RSI
- Gann
- ADXR
- Stochastics
- Volume
- Triangles
- Futures
- Cycles
- Volatility
- ZIGZAG
- MESA
- Retracement
- Aroon
INDICATORS LIST
LIST OF TOPICS
PRINT THIS ARTICLE
by Taylor Ireland
In this article, we examine the order flow and limit order book data in the WTI futures market that provides insight into the sell-side price discovery and establishment of key resistance for Wednesday, July 31, 2019's auction amidst a substantial bullish draw in EIA crude inventory AND 25bps rate cut by the Federal Reserve. Market structure and order flow provide insight into the actual transactional activity of a dual-auction's price discovery process. Analysis of this data provides real-time insight into the actions of market participants, providing a dynamic data-set to inform one's risk management process.
Position: N/A
Taylor Ireland
Sharedata Futures, Inc. provides historical data mining and visualization for the benchmark NYMEX Energy Futures Markets.
Sharedata combines structural analysis of the market generated data, dynamic systems analysis, and Bayesian causal inference techniques favored by the scientific and intelligence communities to provide a robust framework for addressing the uncertainty and risk in energy pricing.
PRINT THIS ARTICLE
DAY TRADING
WTI Weekly: Bullish Fundamentals Vs. Bearish Market Structure: Structure Wins
08/22/19 04:50:33 PMby Taylor Ireland
In this article, we examine the order flow and limit order book data in the WTI futures market that provides insight into the sell-side price discovery and establishment of key resistance for Wednesday, July 31, 2019's auction amidst a substantial bullish draw in EIA crude inventory AND 25bps rate cut by the Federal Reserve. Market structure and order flow provide insight into the actual transactional activity of a dual-auction's price discovery process. Analysis of this data provides real-time insight into the actions of market participants, providing a dynamic data-set to inform one's risk management process.
Position: N/A
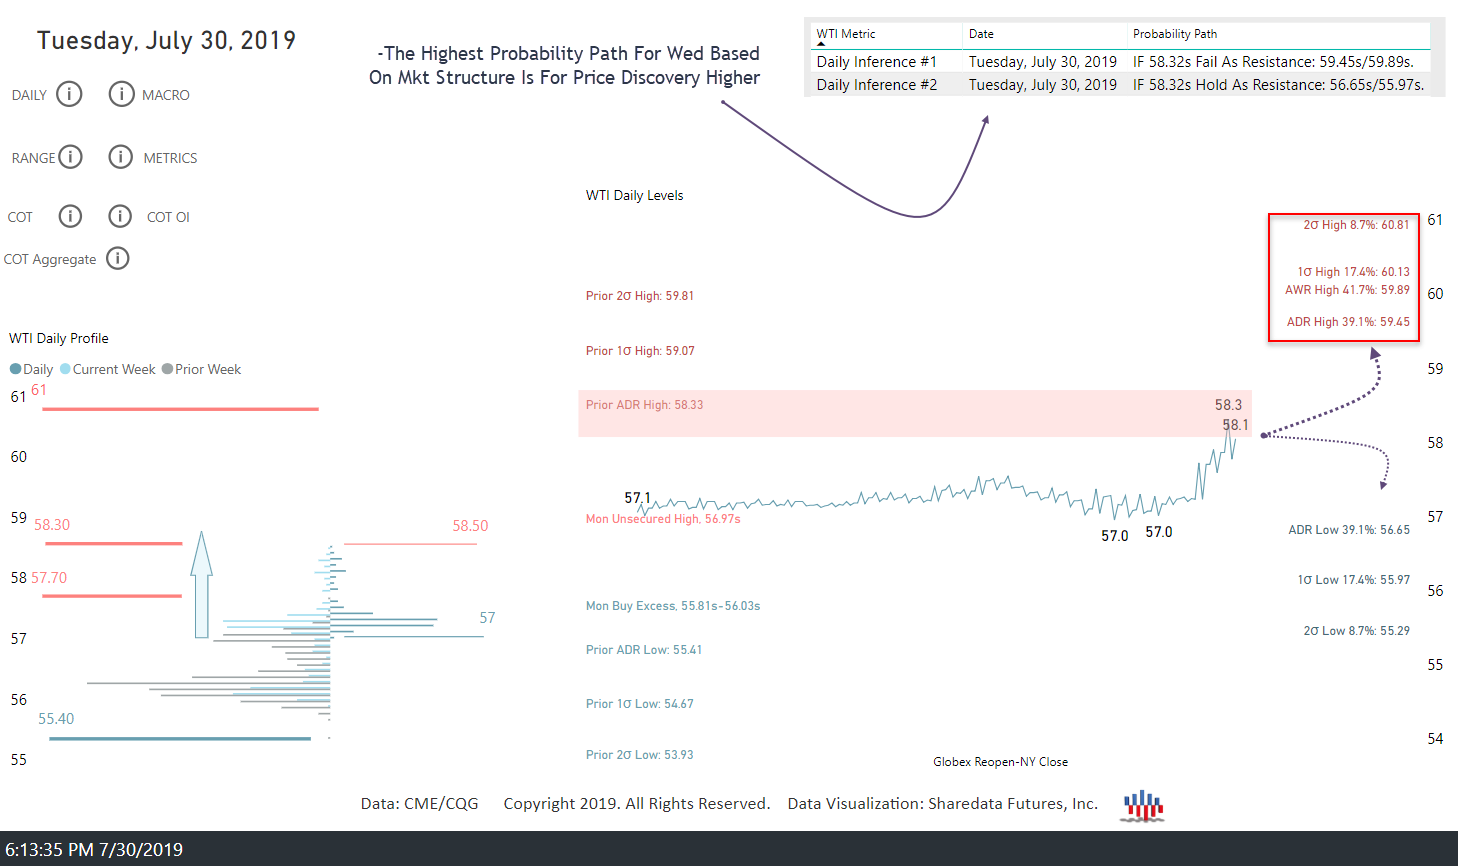
| July 31, 2019: The structural framework provided in Sharedata's Daily Dashboard for Wednesday July 31's auction was for price discovery higher (regardless of the EIA data) based on the buy-side breakout earlier in the week through key resistance, 57.70s/58.30s. While structure favored price discovery higher into Tuesday's NY Close, our daily dual probability path also noted statistical support targets were: 56.65s/55.97s/55.29s. Qualitatively, these levels had held as supports 61%, 87%, and 92% (respectively) of recent market auctions based on the market generated data. This data provided an alternative sell-side framework with a probable support "zone" between 56.65s-55.97s. This type of daily framework, while useful, is made more effective when using live order flow and structural analysis to confirm or negate the most probable daily inference. |
|
| Figure 1. WTI Daily Dashboard For July 31, 2019. |
| Graphic provided by: Sharedata Futures, Inc.. |
| |
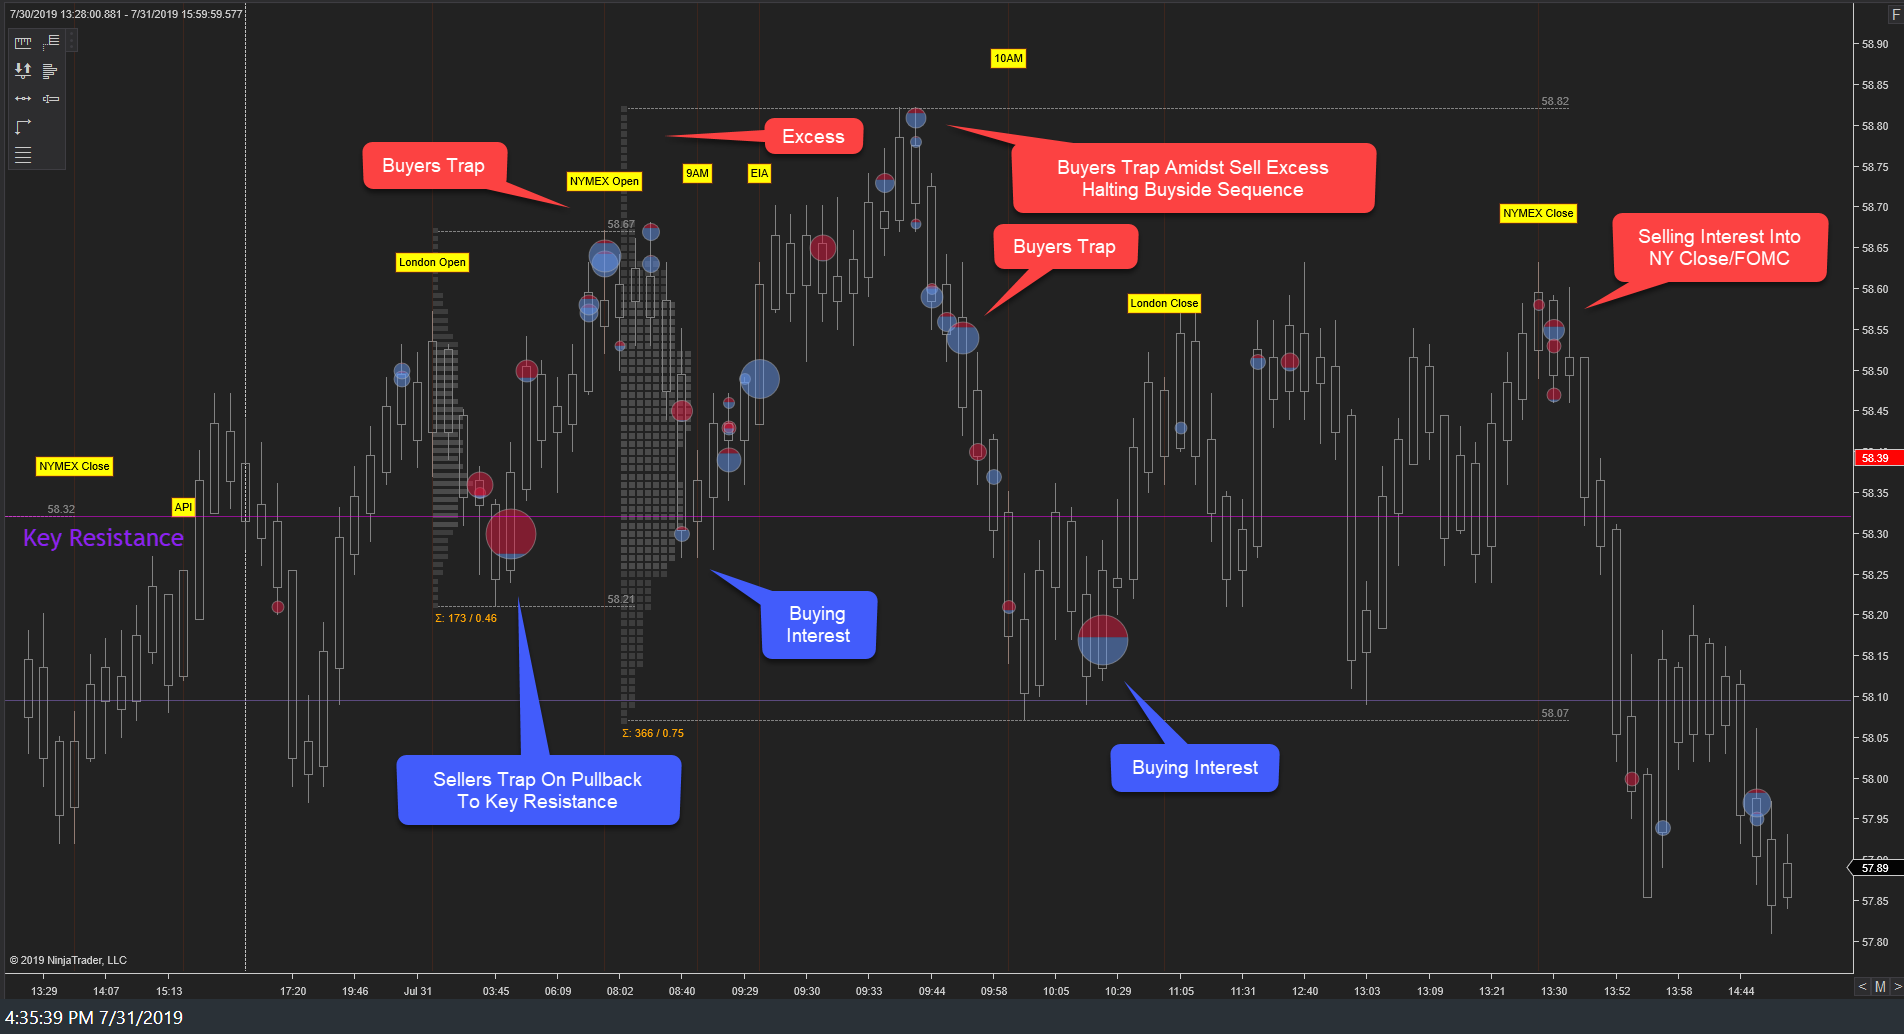
| Heading into Wednesday's auction, Tuesday's key resistance, 58.30s, was probed and failed as resistance during the London auction. Minor price discovery higher then ensued to 58.67s into the NY open. In this case, narrow balance developed early in NY trade, 58.67s-58.30s, as the market awaited the EIA inventory release. Upon the EIA release (-8.5mil v -2.5mil exp), a buy-side breakout attempt developed above the Globex high, achieving the stopping point high, 58.82s. Buyers trapped there as a structural sell excess developed, implying the termination of the buy-side sequence. Price discovery lower ensued to 58.07s where buying interest emerged, halting the sell-side sequence. Balance then developed, 58.07s-58.62s, into the NY close. Selling interest emerged into the NY close, driving price lower still. Despite news of a substantial draw of EIA crude inventory AND a late day rate cut by the Federal Reserve, price traded lower not higher. Despite the hype of inventory draw and Fed rate cuts, market structure and order flow warned that structural resistance had developed. |
|
| Figure 2. WTI Daily Auction for July 31, 23019. |
| Graphic provided by: NinjaTrader. |
| |
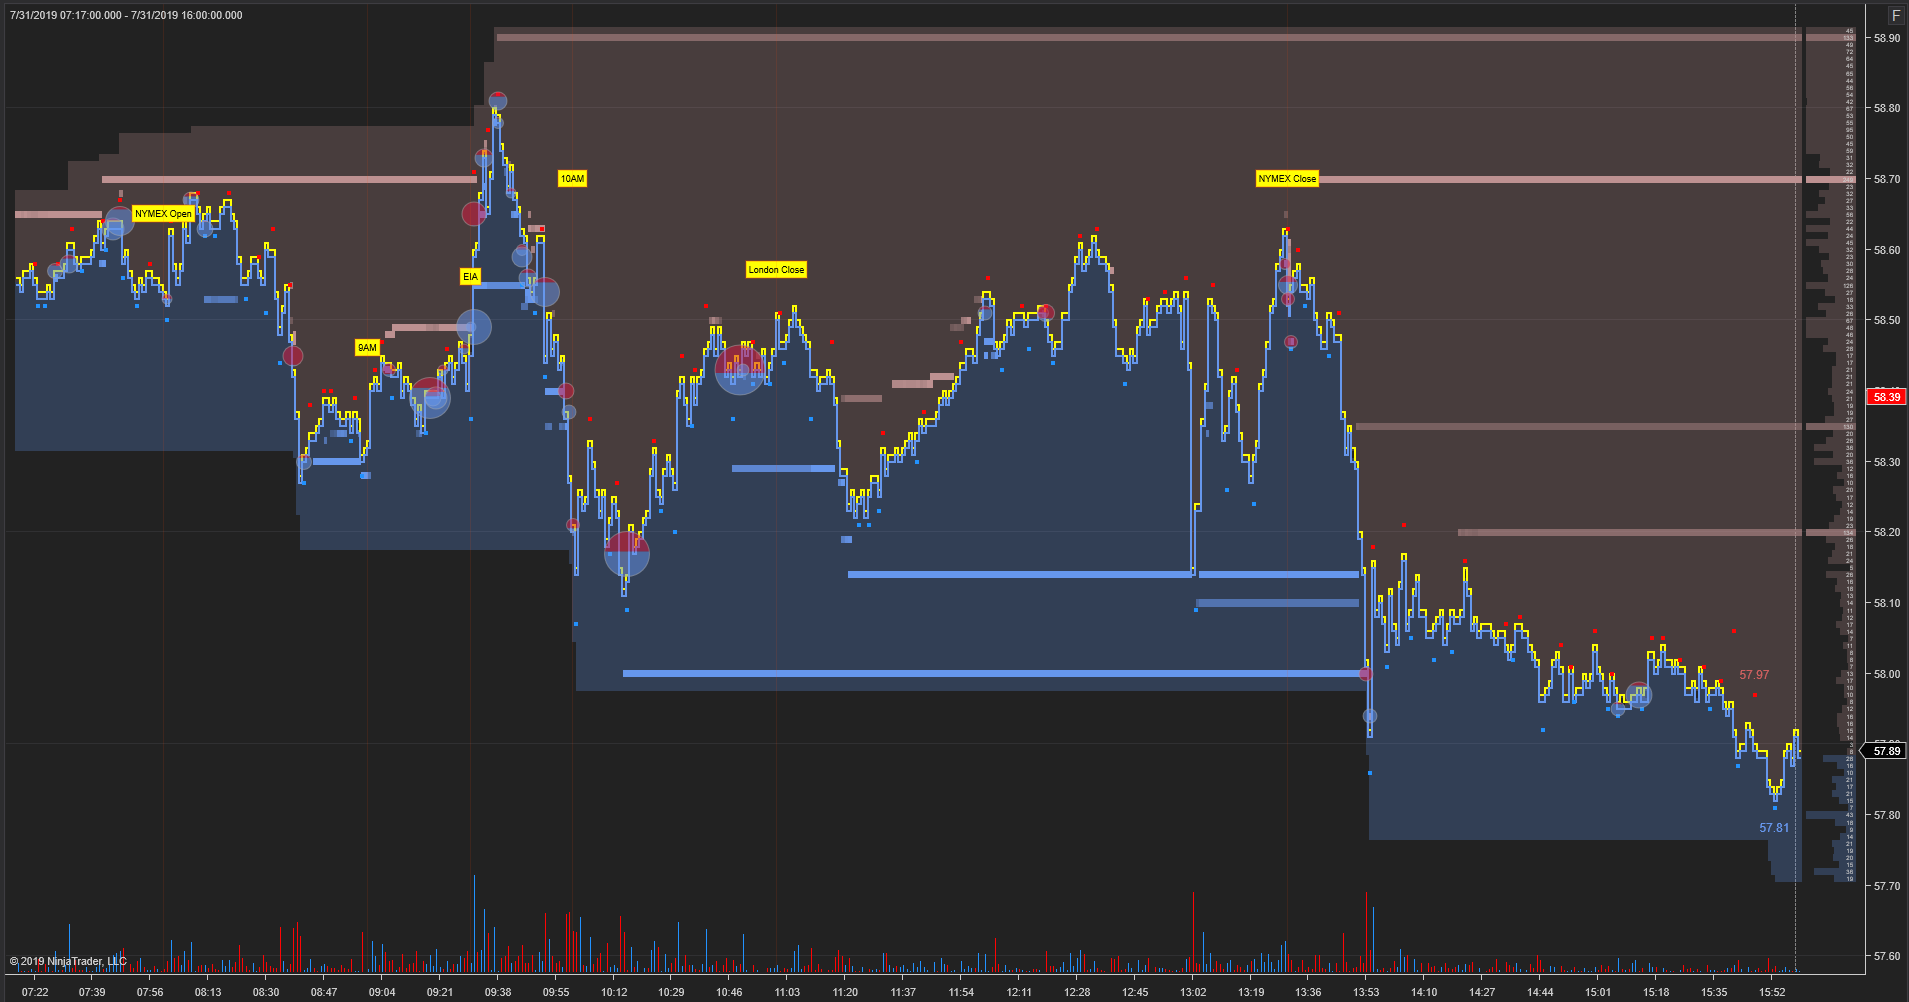
| The practice of analyzing market structure developments is best accomplished with the use of order flow and limit order book (LOB) analysis. In short, plotting the buy and sell transactions of significance (in this case volume equal to or greater than 150 contracts) as well as the resting limit bids and offers (equal to or greater than 75 contracts) allows us to see both the actions and intent of larger participants (who significantly affect price). |
|
| Figure 3. WTI Daily Limit Order Book for July 31, 2019. |
| Graphic provided by: NinjaTrader. |
| |
| In this week's analysis, the key market structure development was the sell excess, 58.82s-58.67s, where large buyers were trapped (evident in the LOB). These developments were indication and warning that the primary daily inference (price discovery higher) would fail. The statistical framework provided support targets which the market failed to auction to intraday. Minor price discovery lower developed intraday amidst balance before selling interest emerged into the NY close, driving price lower through large resting bid liquidity, 58.15s/58s. Ultimately, aggressive price discovery lower developed into the following day's trade (Thursday Aug 1) toward 53.50s. |
|
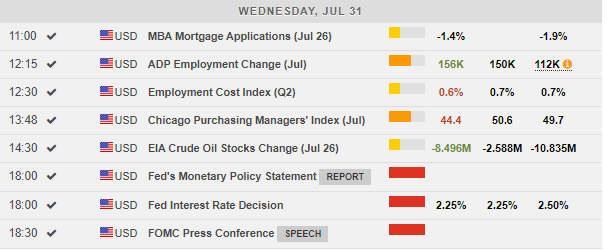
| Figure 4. Economic Releases for July 31, 2019 |
| Graphic provided by: FX Street. |
| |
| The order flow and limit order book data confirmed the sell-side development of the directional context provided by the market structure. The daily framework identified statistical support targets and their qualitative potential to hold as support. This confluence of structural, statistical, and order flow data provided insight into the auction's outcome based not on lagging fundamental data or media hype but rather structural formation and transactional behavior of significant quantity that drives price discovery. |
Sharedata Futures, Inc. provides historical data mining and visualization for the benchmark NYMEX Energy Futures Markets.
Sharedata combines structural analysis of the market generated data, dynamic systems analysis, and Bayesian causal inference techniques favored by the scientific and intelligence communities to provide a robust framework for addressing the uncertainty and risk in energy pricing.
| Title: | Founder |
| Company: | Sharedata Futures, Inc. |
| Dallas, TX | |
| Website: | www.sdfanalytics.com |
| E-mail address: | support@sdfanalytics.com |
Traders' Resource Links | |
| Sharedata Futures, Inc. has not added any product or service information to TRADERS' RESOURCE. | |
Click here for more information about our publications!
PRINT THIS ARTICLE

Request Information From Our Sponsors
- StockCharts.com, Inc.
- Candle Patterns
- Candlestick Charting Explained
- Intermarket Technical Analysis
- John Murphy on Chart Analysis
- John Murphy's Chart Pattern Recognition
- John Murphy's Market Message
- MurphyExplainsMarketAnalysis-Intermarket Analysis
- MurphyExplainsMarketAnalysis-Visual Analysis
- StockCharts.com
- Technical Analysis of the Financial Markets
- The Visual Investor
- VectorVest, Inc.
- Executive Premier Workshop
- One-Day Options Course
- OptionsPro
- Retirement Income Workshop
- Sure-Fire Trading Systems (VectorVest, Inc.)
- Trading as a Business Workshop
- VectorVest 7 EOD
- VectorVest 7 RealTime/IntraDay
- VectorVest AutoTester
- VectorVest Educational Services
- VectorVest OnLine
- VectorVest Options Analyzer
- VectorVest ProGraphics v6.0
- VectorVest ProTrader 7
- VectorVest RealTime Derby Tool
- VectorVest Simulator
- VectorVest Variator
- VectorVest Watchdog