

HOT TOPICS LIST
- MACD
- Fibonacci
- RSI
- Gann
- ADXR
- Stochastics
- Volume
- Triangles
- Futures
- Cycles
- Volatility
- ZIGZAG
- MESA
- Retracement
- Aroon
INDICATORS LIST
LIST OF TOPICS
PRINT THIS ARTICLE
by Billy Williams
Bulls & Bears are duking it out for control at Ground Zero, with one stock that looks like it will help the Bulls win the day.
Position: Buy
Billy Williams
Billy Williams has been trading the markets for 27 years, specializing in momentum trading with stocks and options.
PRINT THIS ARTICLE
Mastec Gives The Edge To The Bulls
08/15/19 04:22:16 PMby Billy Williams
Bulls & Bears are duking it out for control at Ground Zero, with one stock that looks like it will help the Bulls win the day.
Position: Buy
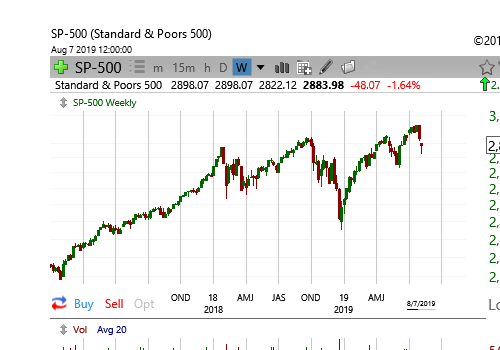
| The markets were rocked by the President's aggressive stance against China but can it derail this Bull? Or is it a just beautiful fiction dreamed up by anxious Bears waiting their turn to control the direction of this market? The S&P has come off its all-time price high as nervous investors quickly jumped ship over the uncertainty of international trade. The U.S. President came forward and called out China as a currency manipulator and promised retaliation if China doesn't curb its rule-bending approach to trade. China has long been known for being a currency manipulator but, instead of griping about it from the side of their mouths, the Americans are becoming more bold in their condemnation. The merits of this strategy will be long debated in the days and weeks to come as well as the far off future as academics debate the pros and cons of this strong-arming of China but, right now, how do you plan to capitalize on it? At the present moment, the Bulls are in charge and while they might have retreated don't show they have passed the baton to the Bears. The weekly SPX chart shows a pullback, and while the price gap is concerning, the dragonfly candlestick shows that Bulls are snapping up shares resulting in the buying pressure pushing up the market. |
|
| Figure 1. The SPX weekly chart shows a strong price gap but the bulls are snapping up shares and showing price support. |
| Graphic provided by: TC2000.com. |
| |
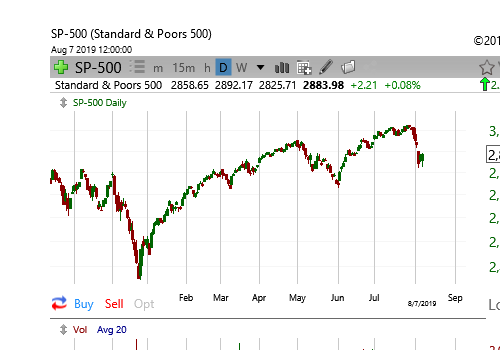
| Chunking down to the daily chart and you can see the battle being waged between the Bulls and Bears as two inside bars have formed, with the latest forming a bullish dragonfly. It is at this point where the market is at Ground Zero for a fundamental change. The daily price gap is heavily weighing down on price but the combination of inside days and dragonfly formation shows the Bulls still have fight. That said, it's at this price level where the future of the market's direction could be decided and your strategy needs to plan for the unexpected. So, what now? |
|
| Figure 2. Despite the downward pressure, two inside bars are forming showing that the Bulls are putting up a fight to keep control of the upward trend. |
| Graphic provided by: TC2000.com. |
| |
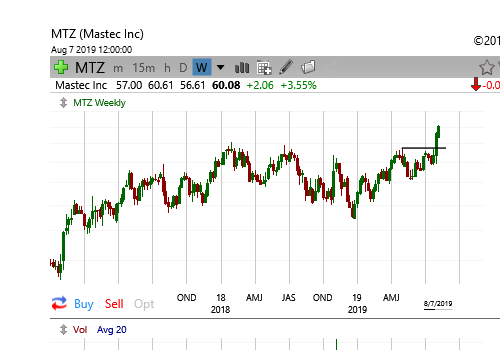
| The Bulls are in control and, for now, that's the direction to trade, but hedging wouldn't be out of line. Better, it should be highly considered. And, if you're going to go long, then betting on the strongest horses leading this race would also be wise. MasTec, Inc.(MTZ), an infrastructure construction company, provides engineering, building, installation, maintenance, and upgrade services for communications, energy, utility, and other infrastructure primarily in the United States and Canada. |
|
| Figure 3. MTZ's weekly chart shows the stock breaking out higher with the potential to lead the market and help give the Bulls some much needed help to control the trend. |
| Graphic provided by: TC2000.com. |
| |
| With revenues steadily climbing over the last 4 years to tip at $7 billion annually the company sports an impressive combination of fundamental and technical traits which indicate it will lead its peer group. Historically, the EPS (earnings per share) is at 41%, with annual EPS growth at 23% compared to 16% for its peers. Adding to that, cash flow (which is a business' lifeblood) is growing year-over-year at 33% compared to 30% for its peer group. The company's stock is trading at all-time highs after breaking higher through a Cup & Handle patter on higher volume. Shrugging off the market's downturn, the stock looks ready to trade higher. |
|
| Figure 4. On the daily chart, MTX breaks out higher leaving an upward price gap on high volume. If volume continues to surge in at these price levels then it sets the stage for a runaway move by MTZ. |
| Graphic provided by: TC2000.com. |
| |
| If you missed the initial breakout then wait for a low-volume pullback to the daily 50-day SMA or the weekly chart's 10-week SMA and enter on the resumption of the upward trend. Factoring in the market's volatility and uncertainty, you might also consider taking a smaller position with tight stops and scale in as the market proves itself by trading higher on strength. |
Billy Williams has been trading the markets for 27 years, specializing in momentum trading with stocks and options.
| Company: | StockOptionSystem.com |
| E-mail address: | stockoptionsystem.com@gmail.com |
Traders' Resource Links | |
| StockOptionSystem.com has not added any product or service information to TRADERS' RESOURCE. | |
Click here for more information about our publications!
PRINT THIS ARTICLE

Request Information From Our Sponsors
- VectorVest, Inc.
- Executive Premier Workshop
- One-Day Options Course
- OptionsPro
- Retirement Income Workshop
- Sure-Fire Trading Systems (VectorVest, Inc.)
- Trading as a Business Workshop
- VectorVest 7 EOD
- VectorVest 7 RealTime/IntraDay
- VectorVest AutoTester
- VectorVest Educational Services
- VectorVest OnLine
- VectorVest Options Analyzer
- VectorVest ProGraphics v6.0
- VectorVest ProTrader 7
- VectorVest RealTime Derby Tool
- VectorVest Simulator
- VectorVest Variator
- VectorVest Watchdog
- StockCharts.com, Inc.
- Candle Patterns
- Candlestick Charting Explained
- Intermarket Technical Analysis
- John Murphy on Chart Analysis
- John Murphy's Chart Pattern Recognition
- John Murphy's Market Message
- MurphyExplainsMarketAnalysis-Intermarket Analysis
- MurphyExplainsMarketAnalysis-Visual Analysis
- StockCharts.com
- Technical Analysis of the Financial Markets
- The Visual Investor