HOT TOPICS LIST
- MACD
- Fibonacci
- RSI
- Gann
- ADXR
- Stochastics
- Volume
- Triangles
- Futures
- Cycles
- Volatility
- ZIGZAG
- MESA
- Retracement
- Aroon
INDICATORS LIST
LIST OF TOPICS
PRINT THIS ARTICLE
by Matt Blackman
It has been a good time for shareholders but there are signs that enthusiasm for the stock may be waning.
Position: N/A
Matt Blackman
Matt Blackman is a full-time technical and financial writer and trader. He produces corporate and financial newsletters, and assists clients in getting published in the mainstream media. He is the host of TradeSystemGuru.com. Matt has earned the Chartered Market Technician (CMT) designation. Find out what stocks and futures Matt is watching on Twitter at www.twitter.com/RatioTrade
PRINT THIS ARTICLE
MONEY FLOW INDEX
Is PETsMART Becoming Shark Bait?
12/23/02 10:58:17 AMby Matt Blackman
It has been a good time for shareholders but there are signs that enthusiasm for the stock may be waning.
Position: N/A
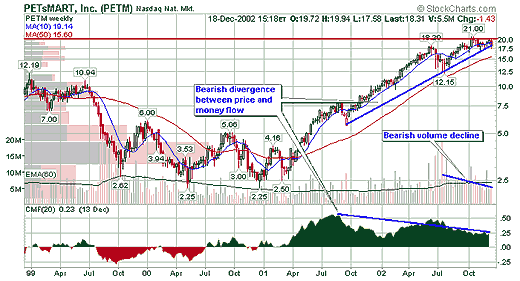
| PETsMART (PETM - NASDAQ-NM) has made some impressive gains in the last year. It is up more than 100% in the last year and more than 700% in last two years. The company was also added to the Nasdaq 100 Index ($COMPQ) on December 16, 2002. But money has been moving out of the equity since July 2002 according to the Chaikin money flow (CMF) indicator and it has also encountered serious resistance at its high of $21.00 (see Figure 1). As the name implies, CMF measures money moving into and out of a security. |
| The stock is also forming a bearish descending triangle on the daily chart. |

|
| Figure 1 – Weekly chart for PETsMART (PETM) from January 1999 to December 2002 showing bearish divergence between price and money flow as well as declining volume. |
| Graphic provided by: StockCharts.com. |
| |
| PETsMART has proven to be an investor haven through tough markets but it may be getting ahead of itself. With a trailing price/earnings ratio of 29 and a forward P/E of 20, the stock is certainly not cheap. Neither is the price-to-book value of 4.29. Earnings per share (EPS) have also dropped steadily in the last four quarters and revenue growth has been flat. Not encouraging signs for buyers betting on the revenue growth that the current price would imply. |
| There are no signs of panic yet but unless earnings pick up soon, it will prove increasingly difficult for PETsMART to attract new investors and it may begin to attract short sellers who like sharks are no doubt beginning to circle the stock looking for blood. |
Matt Blackman is a full-time technical and financial writer and trader. He produces corporate and financial newsletters, and assists clients in getting published in the mainstream media. He is the host of TradeSystemGuru.com. Matt has earned the Chartered Market Technician (CMT) designation. Find out what stocks and futures Matt is watching on Twitter at www.twitter.com/RatioTrade
| Company: | TradeSystemGuru.com |
| Address: | Box 2589 |
| Garibaldi Highlands, BC Canada | |
| Phone # for sales: | 604-898-9069 |
| Fax: | 604-898-9069 |
| Website: | www.tradesystemguru.com |
| E-mail address: | indextradermb@gmail.com |
Traders' Resource Links | |
| TradeSystemGuru.com has not added any product or service information to TRADERS' RESOURCE. | |
Click here for more information about our publications!
Comments
Date: 12/24/02Rank: 3Comment:
Date: 12/24/02Rank: 4Comment:

|

Request Information From Our Sponsors
- StockCharts.com, Inc.
- Candle Patterns
- Candlestick Charting Explained
- Intermarket Technical Analysis
- John Murphy on Chart Analysis
- John Murphy's Chart Pattern Recognition
- John Murphy's Market Message
- MurphyExplainsMarketAnalysis-Intermarket Analysis
- MurphyExplainsMarketAnalysis-Visual Analysis
- StockCharts.com
- Technical Analysis of the Financial Markets
- The Visual Investor
- VectorVest, Inc.
- Executive Premier Workshop
- One-Day Options Course
- OptionsPro
- Retirement Income Workshop
- Sure-Fire Trading Systems (VectorVest, Inc.)
- Trading as a Business Workshop
- VectorVest 7 EOD
- VectorVest 7 RealTime/IntraDay
- VectorVest AutoTester
- VectorVest Educational Services
- VectorVest OnLine
- VectorVest Options Analyzer
- VectorVest ProGraphics v6.0
- VectorVest ProTrader 7
- VectorVest RealTime Derby Tool
- VectorVest Simulator
- VectorVest Variator
- VectorVest Watchdog
