

HOT TOPICS LIST
- MACD
- Fibonacci
- RSI
- Gann
- ADXR
- Stochastics
- Volume
- Triangles
- Futures
- Cycles
- Volatility
- ZIGZAG
- MESA
- Retracement
- Aroon
INDICATORS LIST
LIST OF TOPICS
PRINT THIS ARTICLE
by Stella Osoba, CMT
Cisco Systems, Inc. (CSCO) is a large cap value technology company. It was in the news recently for reaching a settlement with eighteen U.S. states to pay $8.6 million to settle claims that it sold surveillance technology to federal, state and local government agencies that it knew had a serious security flaw. James Glenn was the whistle blower who was working as a CSCO subcontractor in Denmark when in 2008 he discovered that the video software CSCO was selling to governments could be hacked into and taken over without detection. It has taken over a decade for the company to settle the claim resulting from the facts brought to light by Glenn. In that time, how has the share price of this tech juggernaut fared? Let's take a look at some charts.
Position: N/A
Stella Osoba, CMT
Stella Osoba is a trader and financial writer. She is a frequent contributor to "Technical Analysis of Stocks and Commodities" magazine and "Traders.com Advantage" as well as other financial publications.
PRINT THIS ARTICLE
TECHNICAL ANALYSIS
Trading Strong Uptrends
08/15/19 04:00:27 PMby Stella Osoba, CMT
Cisco Systems, Inc. (CSCO) is a large cap value technology company. It was in the news recently for reaching a settlement with eighteen U.S. states to pay $8.6 million to settle claims that it sold surveillance technology to federal, state and local government agencies that it knew had a serious security flaw. James Glenn was the whistle blower who was working as a CSCO subcontractor in Denmark when in 2008 he discovered that the video software CSCO was selling to governments could be hacked into and taken over without detection. It has taken over a decade for the company to settle the claim resulting from the facts brought to light by Glenn. In that time, how has the share price of this tech juggernaut fared? Let's take a look at some charts.
Position: N/A
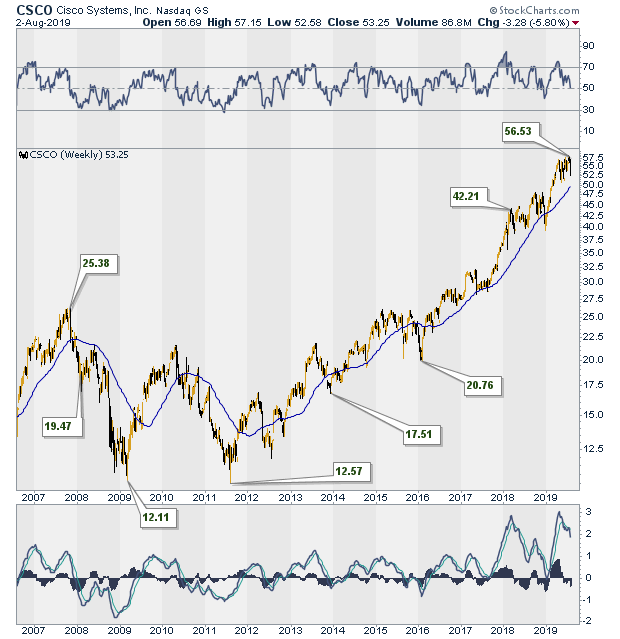
| Figure 1 shows a long term weekly price chart of CSCO. In August 2011, price successfully tested its March 2008 lows. CSCO has been in an uptrend ever since. It has mostly traded above its 50-day moving average, dipping below it only infrequently. So did the whistle blower's charges do any damage to price action? It was not until 2013 that CSCO let its customers know about the flaw in its surveillance systems, which it was still selling. At the same time, it released software updates to fix the problem. In August 2013 the stock, which had been trading above its 50-day moving average dipped, but by December of that year it had reached its reaction low and resumed its uptrend. |
|
| Figure 1. Weekly chart for CSCO. |
| Graphic provided by: StockCharts.com. |
| |
| One reason for the relative lack of impact of the news on price action may be because the news was released together with the bug to fix the problem. As of July 2019, CSCO had a market cap of $227 billion. The settlement it reached with 18 different government entities was $8.6 million total, which in relative terms amounts to less than a slap on the wrist. |
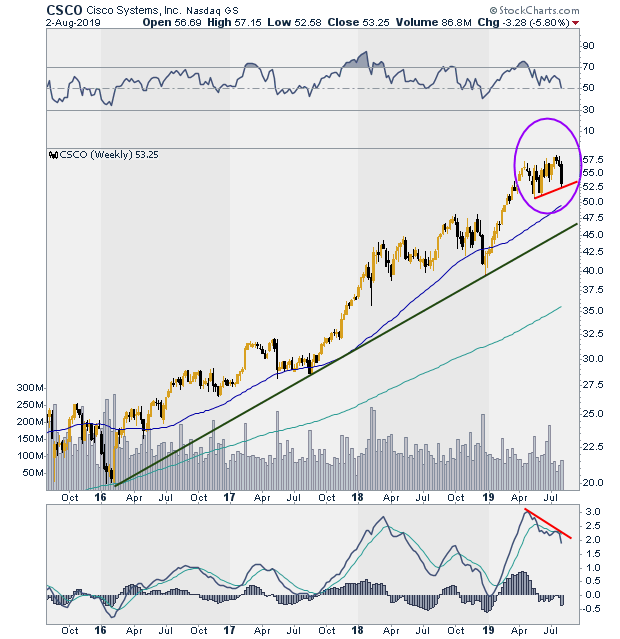
| Figure 2 shows a daily chart of CSCO. Price remains in an uptrend and is still above both its 50-day and 200-day moving averages. At first glance, the chart looks healthy with no obvious technical damage. In a strong uptrend, we want to see higher highs and higher lows, along with unbroken uptrend lines and rising moving averages. |
|
| Figure 2. A more close-up view of the weekly chart. |
| Graphic provided by: StockCharts.com. |
| |
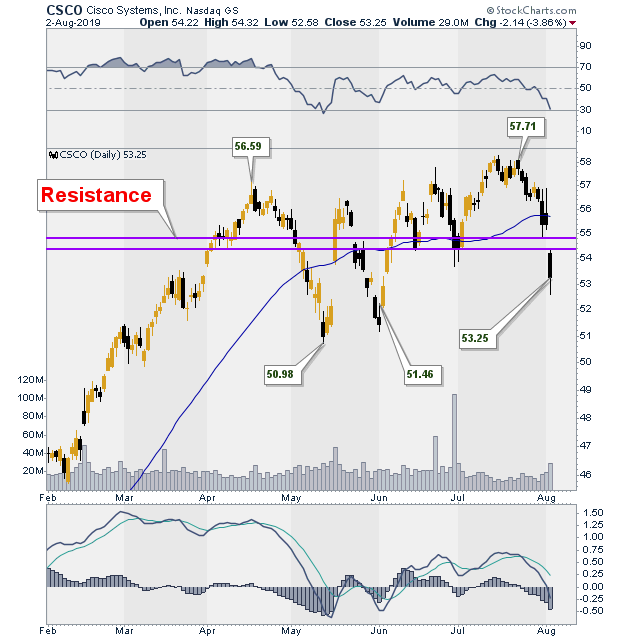
| But as we continue to drill down, Figure 3 should give us reason to pause. This chart shows that since mid April 2019, price has been trading sideways with very little price gains achieved in the last several months. During the week of July 29, 2019, when the DOW lost about 1000 points, CSCO also experienced losses, gapping down on strong bearish price action. Also note the negative divergence with price in Figure 2 which shows price trading sideways to slightly higher, while the MACD in the panel below moves downwards. |
|
| Figure 3. Daily chart for CSCO. |
| Graphic provided by: StockCharts.com. |
| |
| Purple parallel lines show the gap down in price action which is now new resistance as price has closed below it. Watch to see if price can successfully close the gap or if it reaffirms this area of resistance and continues to trade lower. It is wise to remember to trade the charts, not the news. |
Stella Osoba is a trader and financial writer. She is a frequent contributor to "Technical Analysis of Stocks and Commodities" magazine and "Traders.com Advantage" as well as other financial publications.
| E-mail address: | stellaosoba@gmail.com |
Click here for more information about our publications!
PRINT THIS ARTICLE

Request Information From Our Sponsors
- StockCharts.com, Inc.
- Candle Patterns
- Candlestick Charting Explained
- Intermarket Technical Analysis
- John Murphy on Chart Analysis
- John Murphy's Chart Pattern Recognition
- John Murphy's Market Message
- MurphyExplainsMarketAnalysis-Intermarket Analysis
- MurphyExplainsMarketAnalysis-Visual Analysis
- StockCharts.com
- Technical Analysis of the Financial Markets
- The Visual Investor
- VectorVest, Inc.
- Executive Premier Workshop
- One-Day Options Course
- OptionsPro
- Retirement Income Workshop
- Sure-Fire Trading Systems (VectorVest, Inc.)
- Trading as a Business Workshop
- VectorVest 7 EOD
- VectorVest 7 RealTime/IntraDay
- VectorVest AutoTester
- VectorVest Educational Services
- VectorVest OnLine
- VectorVest Options Analyzer
- VectorVest ProGraphics v6.0
- VectorVest ProTrader 7
- VectorVest RealTime Derby Tool
- VectorVest Simulator
- VectorVest Variator
- VectorVest Watchdog