HOT TOPICS LIST
- MACD
- Fibonacci
- RSI
- Gann
- ADXR
- Stochastics
- Volume
- Triangles
- Futures
- Cycles
- Volatility
- ZIGZAG
- MESA
- Retracement
- Aroon
INDICATORS LIST
LIST OF TOPICS
PRINT THIS ARTICLE
by Mark Rivest
Technical analysis helps to chart the path of a cryptocurrency.
Position: Buy
Mark Rivest
Independent investment advisor, trader and writer. He has written articles for Technical Analysis of Stocks & Commodities, Traders.com Advantage,Futuresmag.com and, Finance Magnates. Author of website Four Dimension Trading.
PRINT THIS ARTICLE
ELLIOTT WAVE
Bitcoin Clear Signals
08/02/19 12:12:55 PMby Mark Rivest
Technical analysis helps to chart the path of a cryptocurrency.
Position: Buy
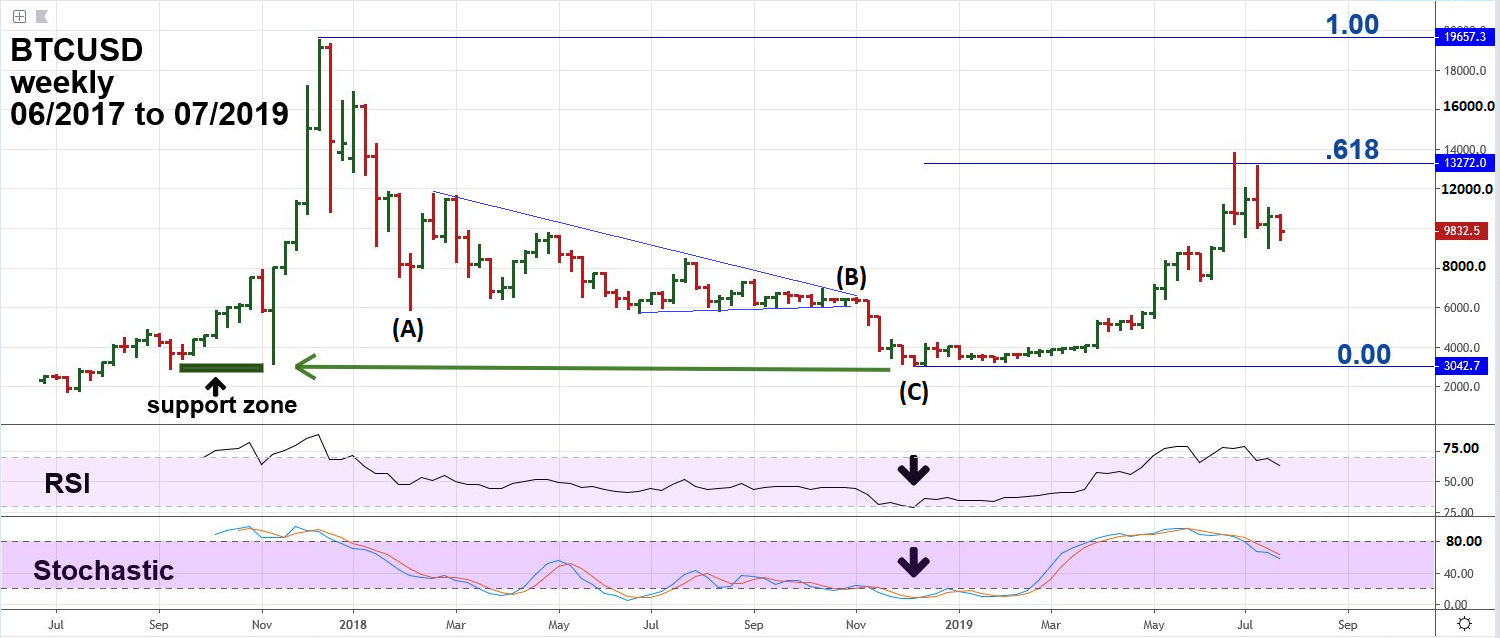
| Bitcoin/U.S. Dollar (BTCUSD) is the most popular Bitcoin pairing in the world. Bitcoin operate with no central authority or banks managing transactions. Bitcoin is open source, its design is public, nobody owns or controls this cryptocurrency, and everyone can take part. These factors could be why BTCUSD has very clear patterns and signals. Bitcoin Weekly Within the last two years BTCUSD has generated several very clear trading signals. Please see the weekly BTCUSD chart illustrated in Figure 1. After BTCUSD's all-time high in December 2017 there was a sharp and deep decline. This is typical action after a market peaks on a parabolic move; the bulls have no significant support levels to grab on to, and the bears run wild. In just under two months BTCUSD fell more than 69%, however the early February bottom came without the weekly Stochastic reaching the oversold zone, hinting that the next rally could be completely retraced. The initial three-week rally turned out to be the first wave of an Elliott wave Horizontal Triangle which lasted until October 2018. Usually, after completion of this pattern there's a post triangle thrust in the direction of the primary trend, which in this case was down. An excellent shorting opportunity existed just below the double bottom of the 5941.20 wave (A) low and the 5788.50 late June 2018 low point of the Horizontal Triangle. The subsequent thrust down finally brought the weekly Stochastics to the oversold zone which corresponded with the last significant support area of the prior bull market at the September 2017 bottom of 2975.00. |

|
| Figure 1. An excellent shorting opportunity existed just below the double bottom of the 5941.20 wave (A) low and the 5788.50 late June 2018 low point of the Horizontal Triangle. |
| Graphic provided by: tradingview.com. |
| |
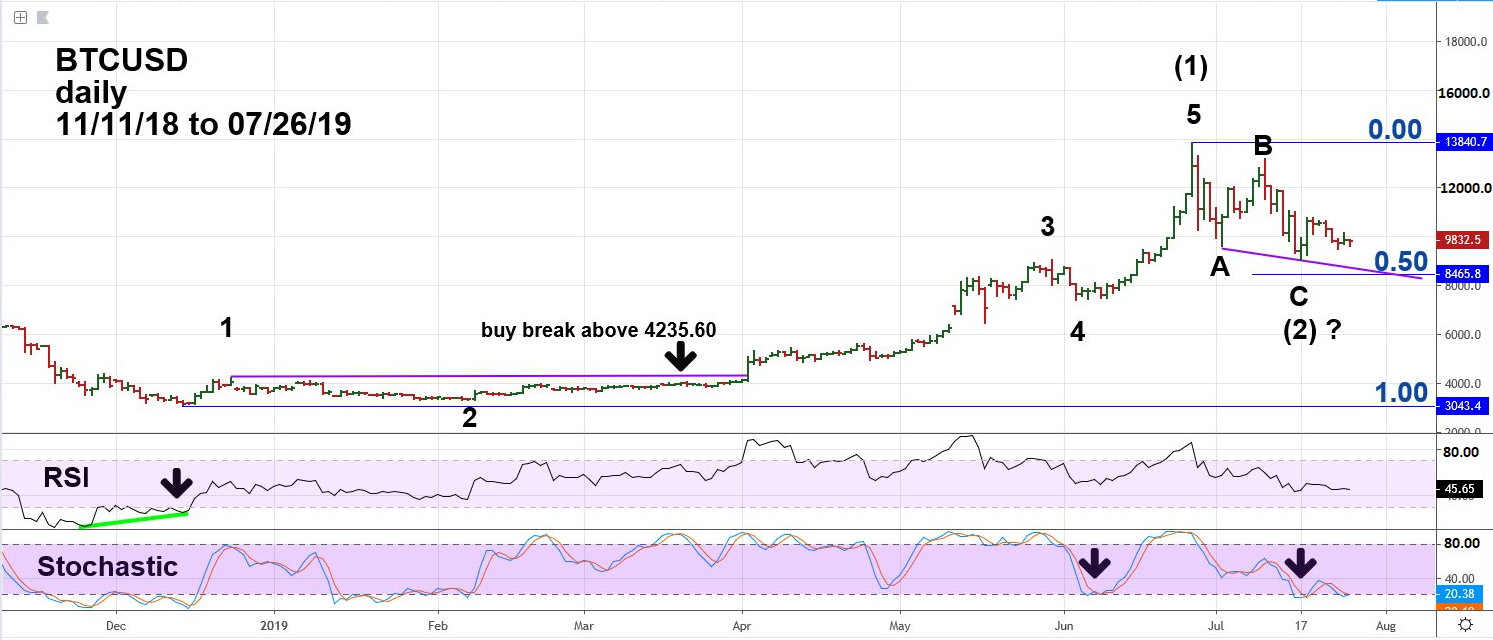
| Bitcoin Daily Please see the daily BTCUSD chart illustrated in Figure 2. When a market's weekly indicator signals a bottom could be approaching, the next step is to examine the daily indicators to find a more specific entry point. As BTCUSD was completing its nearly one-year bear market the daily RSI had a double bullish divergence at the same time the daily Stochastic was deeply in the oversold zone. Great signals to go long! When BTCUSD bottomed on December 14, 2018 it had lost over 83% of its value from the December 2017 high. At this point the crowd is viewing any rally as just another bounce in an ongoing bear market. It's typical after such a mega decline that bears will strongly sell rally attempts, which is what happened after the initial rally off the 3136 bottom. BTCUSD went into a three-month base. In basing situations, the most reliable signals to go long are on break outs above the base. The April 2, 2019 thrust above the base high point of 4235.60 proved to be another great signal to go long. The subsequent rally from the December 2018 bottom has been a very clear Elliott five-wave Impulse that terminated just above a .618 retrace of the one-year bear market. After completion of a five-wave impulse rally the subsequent decline is usually larger in both price and time than any of the prior counter trend moves within the impulse wave. The decline so far from the June 26 high of 13854 has been an Elliott three wave Single Zigzag corrective pattern. However, the correction could continue — perhaps forming a Double Zigzag correction targeting a 50% retrace of the December 2018 to June 2019 rally. If BTCUSD declines into the 50% retracement level this could be another great opportunity to establish long positions. If this level is not reached the next best place to go long could be a break above the high point of wave "B" at 13189, setting up a challenge of the June top at 13854. A move above the June high could open the door to climb up to the all-time high. |

|
| Figure 2. As BTCUSD was completing its nearly one-year bear market the daily RSI had a double bullish divergence. |
| Graphic provided by: tradingview.com. |
| |
| Easiest Market to Forecast? From both Elliott wave theory and standard technical analysis, BTCUSD has perhaps the clearest signals of any market in the world There are many ways to get faked out in any market, so it's important to give yourself the greatest possible advantage when selecting trading instruments. For the next six months to a year BTCUSD may possibly give you that advantage. Further Reading: Frost A.J and Robert Prechter (1985) "Elliott Wave Principle", New Classics Library. |
Independent investment advisor, trader and writer. He has written articles for Technical Analysis of Stocks & Commodities, Traders.com Advantage,Futuresmag.com and, Finance Magnates. Author of website Four Dimension Trading.
| Website: | www.fourdimensiontrading.com |
| E-mail address: | markrivest@gmail.com |
Click here for more information about our publications!
PRINT THIS ARTICLE

Request Information From Our Sponsors
- StockCharts.com, Inc.
- Candle Patterns
- Candlestick Charting Explained
- Intermarket Technical Analysis
- John Murphy on Chart Analysis
- John Murphy's Chart Pattern Recognition
- John Murphy's Market Message
- MurphyExplainsMarketAnalysis-Intermarket Analysis
- MurphyExplainsMarketAnalysis-Visual Analysis
- StockCharts.com
- Technical Analysis of the Financial Markets
- The Visual Investor
- VectorVest, Inc.
- Executive Premier Workshop
- One-Day Options Course
- OptionsPro
- Retirement Income Workshop
- Sure-Fire Trading Systems (VectorVest, Inc.)
- Trading as a Business Workshop
- VectorVest 7 EOD
- VectorVest 7 RealTime/IntraDay
- VectorVest AutoTester
- VectorVest Educational Services
- VectorVest OnLine
- VectorVest Options Analyzer
- VectorVest ProGraphics v6.0
- VectorVest ProTrader 7
- VectorVest RealTime Derby Tool
- VectorVest Simulator
- VectorVest Variator
- VectorVest Watchdog
