HOT TOPICS LIST
- MACD
- Fibonacci
- RSI
- Gann
- ADXR
- Stochastics
- Volume
- Triangles
- Futures
- Cycles
- Volatility
- ZIGZAG
- MESA
- Retracement
- Aroon
INDICATORS LIST
LIST OF TOPICS
PRINT THIS ARTICLE
by Stella Osoba, CMT
Equifax (EFX) confirmed a data hack affecting over 200,000 of its customers on July 29, 2017. But the full extent of the breach was not revealed until September 2017, when EFX announced that the data breach had exposed the personal information of about 147 million people. In July 2019, the Federal Trade Commission announced that EFX had agreed to a global settlement with the FTC, the Consumer Financial Protection Bureau and 50 US states and territories. The settlement includes up to $425 million to help people affected by the data breach. This short piece will look at the recent price action of the stock to see if there were any tradable opportunities resulting in the bad news swirling around the company.
Position: N/A
Stella Osoba, CMT
Stella Osoba is a trader and financial writer. She is a frequent contributor to "Technical Analysis of Stocks and Commodities" magazine and "Traders.com Advantage" as well as other financial publications.
PRINT THIS ARTICLE
TECHNICAL ANALYSIS
Trading On Bad News
08/01/19 12:48:05 PMby Stella Osoba, CMT
Equifax (EFX) confirmed a data hack affecting over 200,000 of its customers on July 29, 2017. But the full extent of the breach was not revealed until September 2017, when EFX announced that the data breach had exposed the personal information of about 147 million people. In July 2019, the Federal Trade Commission announced that EFX had agreed to a global settlement with the FTC, the Consumer Financial Protection Bureau and 50 US states and territories. The settlement includes up to $425 million to help people affected by the data breach. This short piece will look at the recent price action of the stock to see if there were any tradable opportunities resulting in the bad news swirling around the company.
Position: N/A
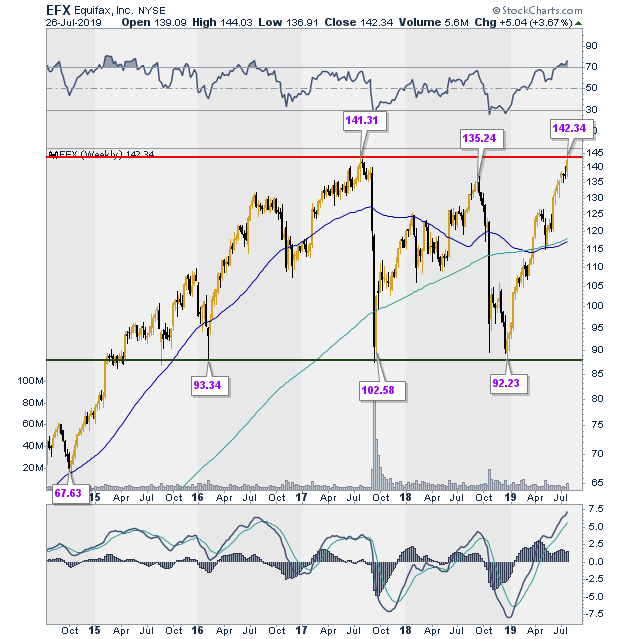
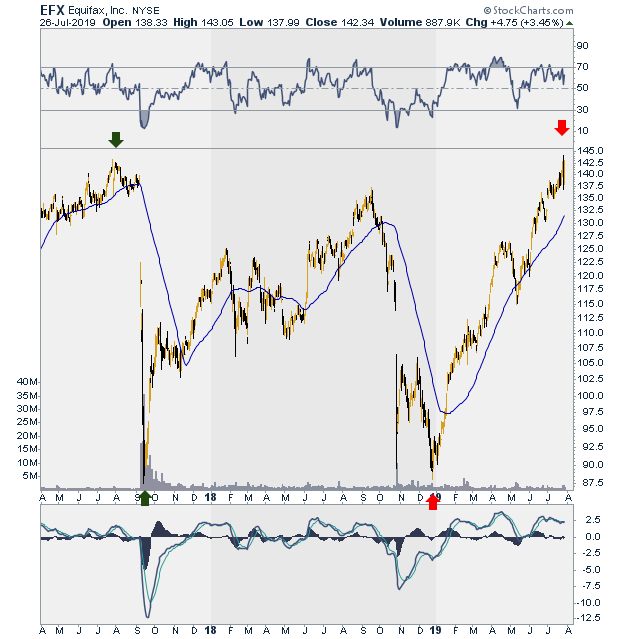
| Figure 1 is a weekly chart showing the price action of EFX over the last five years. We can see that EFX was in a strong uptrend as we entered mid 2017. Figure 2 is a daily showing price action during the period in more detail. The green arrow to the left of the chart shows the price action around July 29, 2017, when news of the data breach was first announced by the company. It took a few weeks of sideways trading for the full significance of the data breach to work its way into price action and on September 8th, 2017, the stock experienced its first plunge of the period. This plunge ended at the level of a previous low reached in September 2016 (see Figure 1). |

|
| Figure 1. Weekly chart for EFX. |
| Graphic provided by: StockCharts.com. |
| |
| The stock then proceeded to rise, and there was an unsuccessful test of the previous high in September 2018 when the stock traded at around $135.25. This test, as the chart shows, was unsuccessful as price failed and experienced another steep decline. The decline also stopped at previous support (see Figure 1). Thereupon price rose, traded sideways and proceeded to test yet again support in December 2018. So Figure 1 shows that EFX had successfully tested support four times. |
| By December 2018, the news was not yet out that EFX had reached a settlement in its data breach case. But the chart was telling us that price action was successfully testing support (see Figure 2). This last test of support was the reversal. The stock put in its low on December 26, 2018, at $92.08. If one were watching the stock, it would have been an acceptable trade to put a buy order when the stock showed confirmation of the reversal by the consecutive strong bullish candles, with a stop below the green support line, illustrated on Figure 1. |

|
| Figure 2. Daily chart for EFX. |
| Graphic provided by: StockCharts.com. |
| |
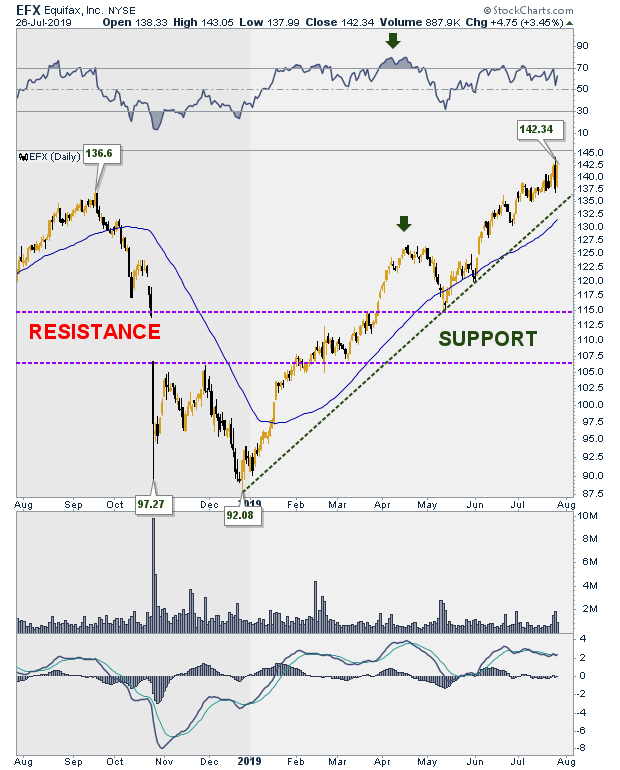
| The settlement was not announced until July 2019, by which time, the uptrend in the stock was well in effect which the uptrend line on Figure 3 shows. Waiting for good news as a signal to enter the trade would have been too late. At a close of $142.34 on July 26, 2019, the stock is now trading at new highs, and might be ready to react. The unbroken uptrend line means that the uptrend is still in effect, but waiting for a better entry on a reaction would be preferential to buying an expensive stock and seeing almost immediate losses. |

|
| Figure 3. Daily EFX chart showing recent uptrend. |
| Graphic provided by: StockCharts.com. |
| |
Stella Osoba is a trader and financial writer. She is a frequent contributor to "Technical Analysis of Stocks and Commodities" magazine and "Traders.com Advantage" as well as other financial publications.
| E-mail address: | stellaosoba@gmail.com |
Click here for more information about our publications!
PRINT THIS ARTICLE

Request Information From Our Sponsors
- StockCharts.com, Inc.
- Candle Patterns
- Candlestick Charting Explained
- Intermarket Technical Analysis
- John Murphy on Chart Analysis
- John Murphy's Chart Pattern Recognition
- John Murphy's Market Message
- MurphyExplainsMarketAnalysis-Intermarket Analysis
- MurphyExplainsMarketAnalysis-Visual Analysis
- StockCharts.com
- Technical Analysis of the Financial Markets
- The Visual Investor
- VectorVest, Inc.
- Executive Premier Workshop
- One-Day Options Course
- OptionsPro
- Retirement Income Workshop
- Sure-Fire Trading Systems (VectorVest, Inc.)
- Trading as a Business Workshop
- VectorVest 7 EOD
- VectorVest 7 RealTime/IntraDay
- VectorVest AutoTester
- VectorVest Educational Services
- VectorVest OnLine
- VectorVest Options Analyzer
- VectorVest ProGraphics v6.0
- VectorVest ProTrader 7
- VectorVest RealTime Derby Tool
- VectorVest Simulator
- VectorVest Variator
- VectorVest Watchdog
