

HOT TOPICS LIST
- MACD
- Fibonacci
- RSI
- Gann
- ADXR
- Stochastics
- Volume
- Triangles
- Futures
- Cycles
- Volatility
- ZIGZAG
- MESA
- Retracement
- Aroon
INDICATORS LIST
LIST OF TOPICS
PRINT THIS ARTICLE
by Taylor Ireland
In this article, we examine the order flow and limit order book data in the WTI futures market that provides insight into the sell-side price discovery and failure of support for Tuesday, July 2, 2019's auction following OPEC's pomp and circumstance. Market structure and order flow provide insight into the actual transactional activity of a dual-auction's price discovery process. Analysis of this data provides real-time insight into the actions of market participants, providing a dynamic dataset to inform one's risk management process.
Position: N/A
Taylor Ireland
Sharedata Futures, Inc. provides historical data mining and visualization for the benchmark NYMEX Energy Futures Markets.
Sharedata combines structural analysis of the market generated data, dynamic systems analysis, and Bayesian causal inference techniques favored by the scientific and intelligence communities to provide a robust framework for addressing the uncertainty and risk in energy pricing.
PRINT THIS ARTICLE
DAY TRADING
WTI Weekly, OPEC, NOPEC: A Look At Market Structure & Order Flow v Fundamental Expectations.
07/18/19 05:09:41 PMby Taylor Ireland
In this article, we examine the order flow and limit order book data in the WTI futures market that provides insight into the sell-side price discovery and failure of support for Tuesday, July 2, 2019's auction following OPEC's pomp and circumstance. Market structure and order flow provide insight into the actual transactional activity of a dual-auction's price discovery process. Analysis of this data provides real-time insight into the actions of market participants, providing a dynamic dataset to inform one's risk management process.
Position: N/A
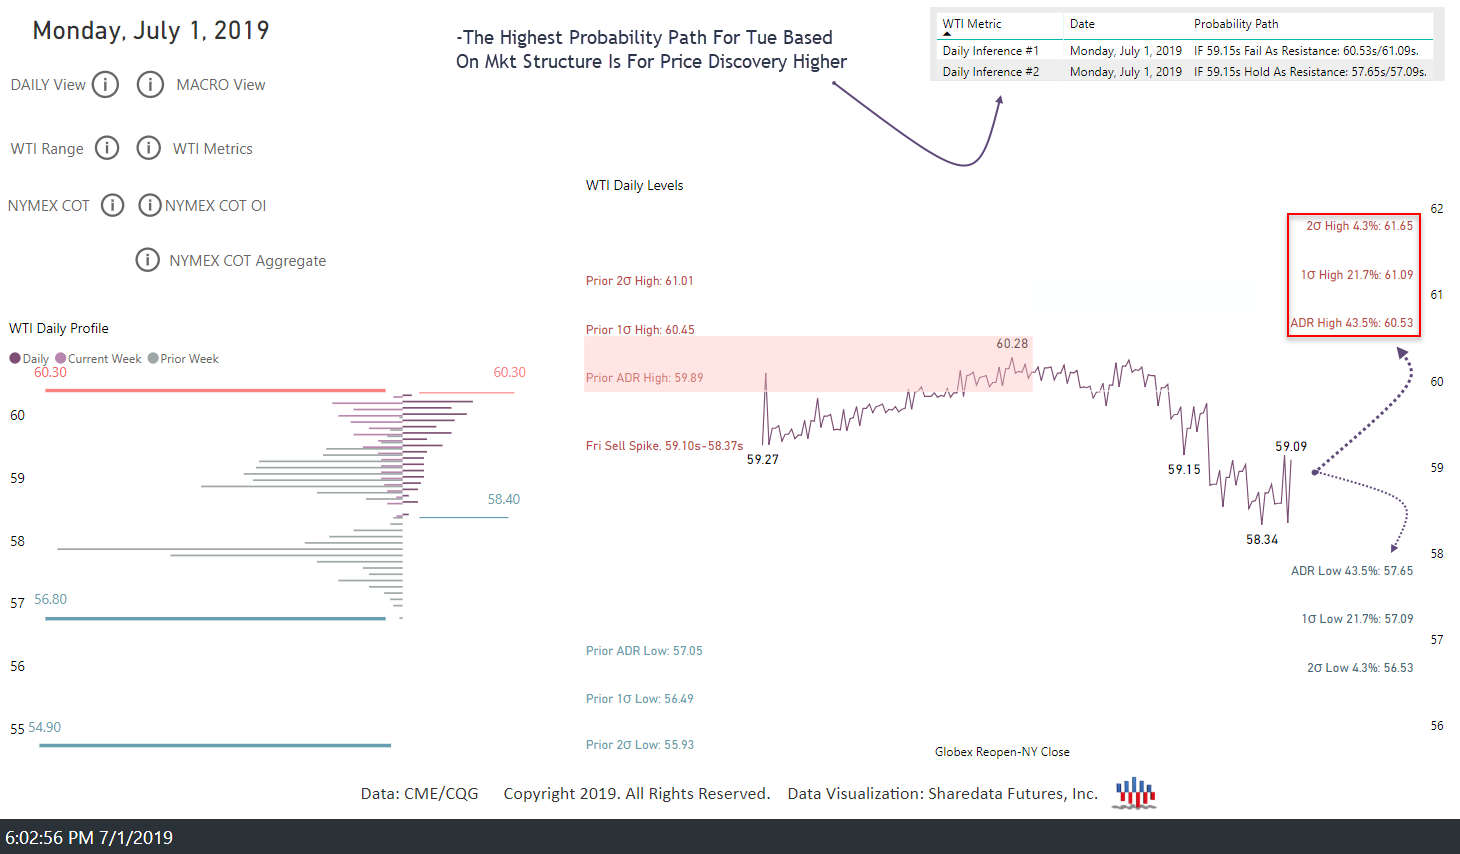
| July 2, 2019: The structural framework provided in Sharedata's Daily Dashboard for Tuesday, July 2 auction was for price discovery higher as the market digested the initial day of OPEC talks, waiting for Tuesday's OPEC+ (OPEC + Russia) decision. While structure favored price discovery higher into Monday's NY Close, our daily dual probability path noted statistical support targets were: 57.65s/57.09s/56.53s. Qualitatively, these levels had held as supports 54%, 78%, and 96% (respectively) of recent market auctions based on the market generated data. This data provided an alternative sell-side framework with a probable support "zone" between 57.65s-57.09s. This type of daily framework, while useful, is made more effective when using live order flow and structural analysis to confirm or negate the most probable daily inference. |
|
| WTI Daily Dual Probability Dashboard For 02July 2019 |
| Graphic provided by: Sharedata Futures, Inc.. |
| |
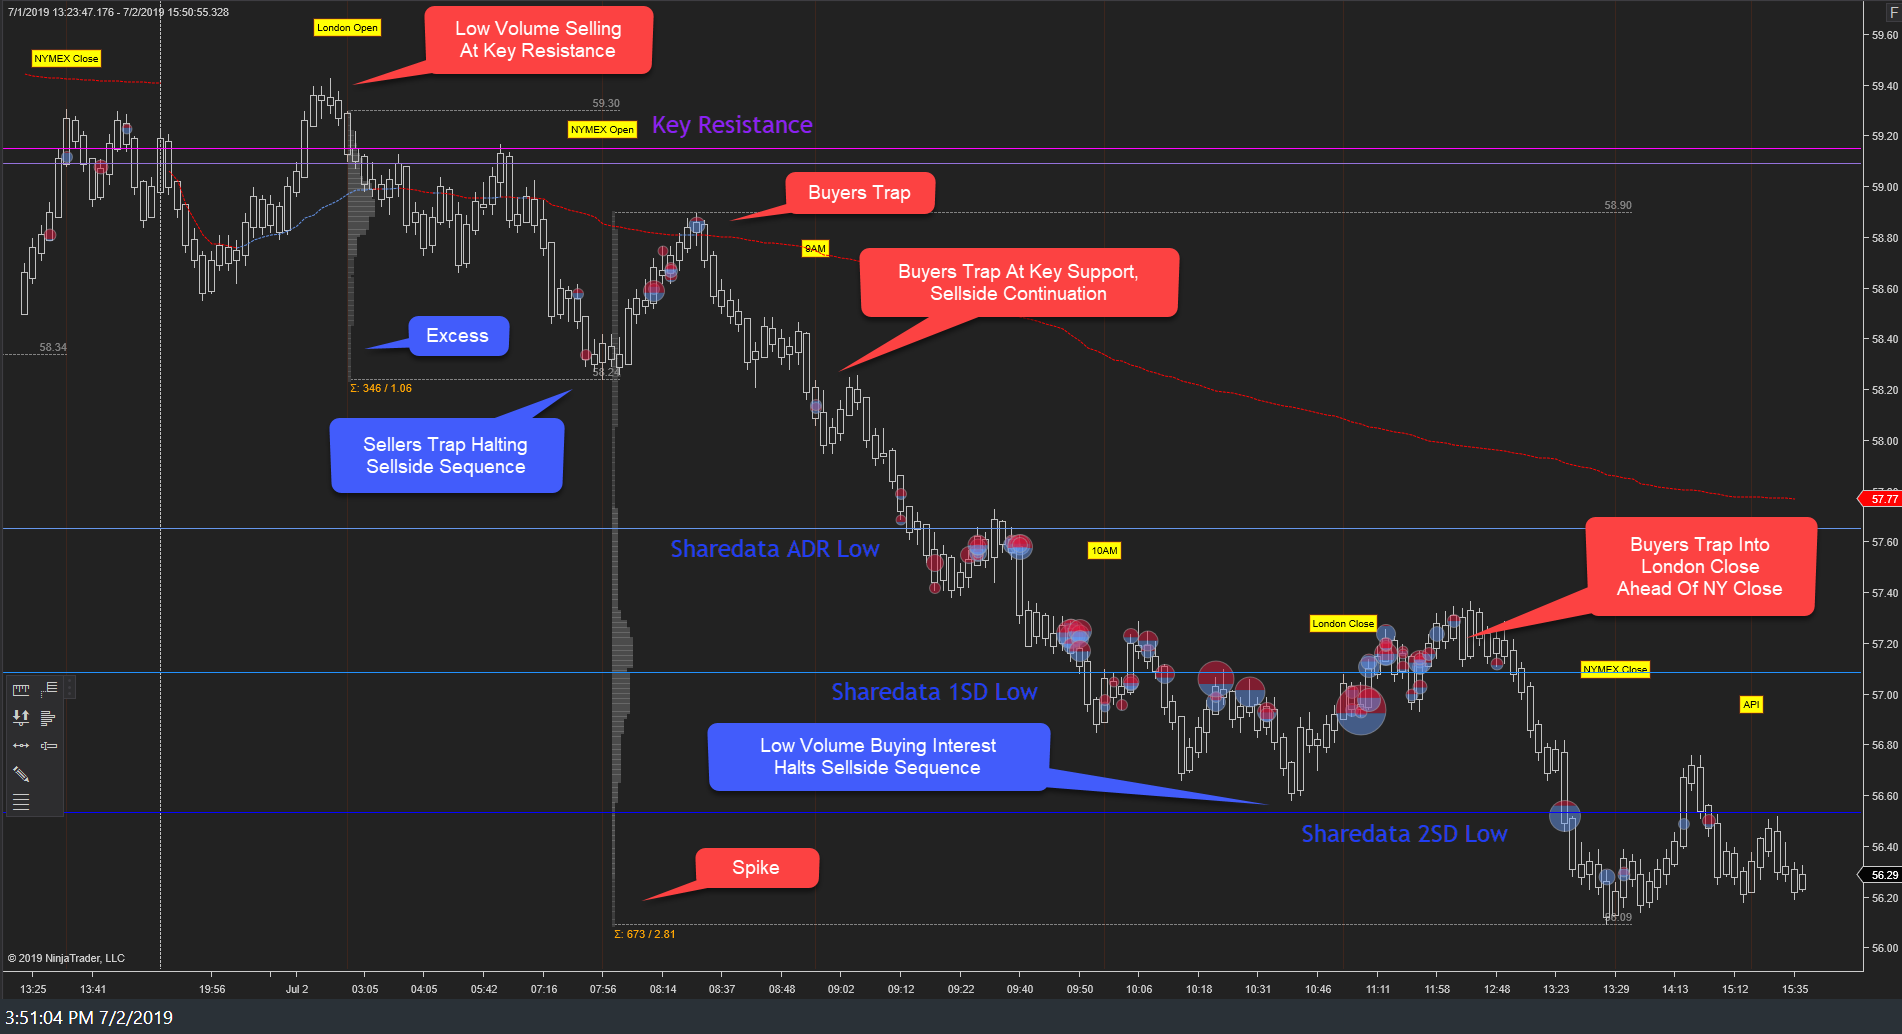
| Heading into Tuesday's auction, Monday's key resistance, 59.15s, was probed but held as resistance during the London auction. Price discovery lower then ensued just ahead of the NY open toward Monday's key support, 58.34s. In this case, buyers trapped early in the NY auction at the Daily Volume Weighted Average Price (VWAP) as the Limit Order Book (LOB) trend shifted lower. Price discovery lower continued as buyers then trapped at Monday's key support area, driving price lower in a sell-side directional sequence. Ultimately, buying interest halted the sell-side sequence at/near 56.60s, Sharedata's 2nd standard deviation low target into Tuesday's London close, halting the sell-side sequence temporarily. A minor relief rally then developed toward 57.30s where buyers trapped amidst large offers in the LOB. Two-sided trade developed ahead of the NY close before the LOB trend again shifted lower as price discovery through the intra-day support near 56.60s failed as buyers trapped there. Despite news of OPEC+ production cuts and media hysteria of imminent risk due to Persian Gulf events with Iran, substantial price discovery lower occurred. Market structure and the transactional data of significance (order flow and LOB data of size) told a different story. |
|
| WTI Daily Auction 02July 2019 |
| Graphic provided by: NinjaTrader. |
| |
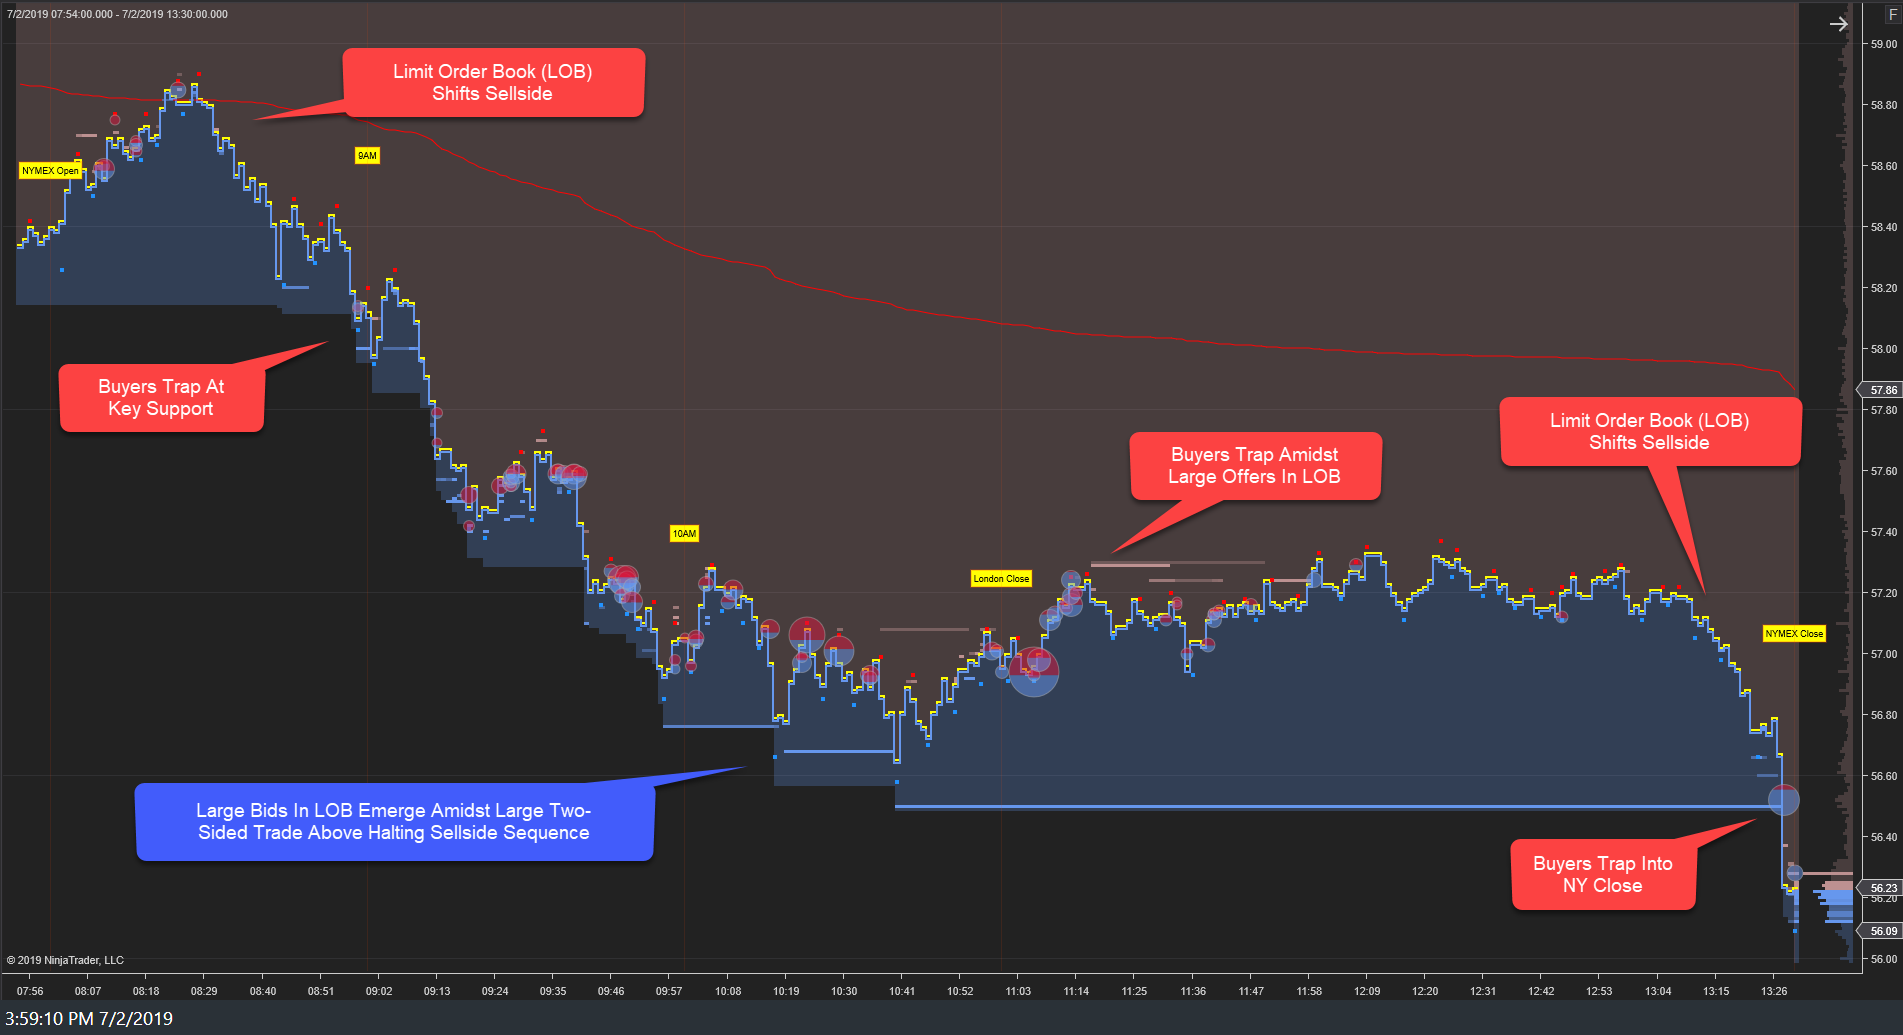
| The practice of analyzing market structure developments is best accomplished with the use of order flow and limit order book (LOB) analysis. In short, plotting the buy and sell transactions of significance (in this case volume equal to or greater than 150 contracts) as well as the resting limit bids and offers (equal to or greater than 75 contracts) allows us to see both the actions and intent of larger participants (who significantly affect price). |
| In this week's analysis, the key market structure development was sell-side defense of key resistance and later the daily VWAP. These developments were indication and warning that the primary daily inference (price discovery higher) would fail. The statistical framework provided support targets to which the market auctioned toward, ultimately trading through in the NY Close. |
|
| WTI Daily Limit Order Book 02July 2019 |
| Graphic provided by: NinjaTrader. |
| |
| The order flow and limit order book data confirmed the sell-side development of the directional context provided by the market structure. The daily framework identified statistical support targets and their qualitative potential to hold as support. This confluence of structural, statistical, and order flow data provided insight into the auction's outcome based not on lagging fundamental data or media hype but rather structural formation and transactional behavior of significant quantity that drives price discovery. |
Sharedata Futures, Inc. provides historical data mining and visualization for the benchmark NYMEX Energy Futures Markets.
Sharedata combines structural analysis of the market generated data, dynamic systems analysis, and Bayesian causal inference techniques favored by the scientific and intelligence communities to provide a robust framework for addressing the uncertainty and risk in energy pricing.
| Title: | Founder |
| Company: | Sharedata Futures, Inc. |
| Dallas, TX | |
| Website: | www.sdfanalytics.com |
| E-mail address: | support@sdfanalytics.com |
Traders' Resource Links | |
| Sharedata Futures, Inc. has not added any product or service information to TRADERS' RESOURCE. | |
Click here for more information about our publications!
PRINT THIS ARTICLE

Request Information From Our Sponsors
- StockCharts.com, Inc.
- Candle Patterns
- Candlestick Charting Explained
- Intermarket Technical Analysis
- John Murphy on Chart Analysis
- John Murphy's Chart Pattern Recognition
- John Murphy's Market Message
- MurphyExplainsMarketAnalysis-Intermarket Analysis
- MurphyExplainsMarketAnalysis-Visual Analysis
- StockCharts.com
- Technical Analysis of the Financial Markets
- The Visual Investor
- VectorVest, Inc.
- Executive Premier Workshop
- One-Day Options Course
- OptionsPro
- Retirement Income Workshop
- Sure-Fire Trading Systems (VectorVest, Inc.)
- Trading as a Business Workshop
- VectorVest 7 EOD
- VectorVest 7 RealTime/IntraDay
- VectorVest AutoTester
- VectorVest Educational Services
- VectorVest OnLine
- VectorVest Options Analyzer
- VectorVest ProGraphics v6.0
- VectorVest ProTrader 7
- VectorVest RealTime Derby Tool
- VectorVest Simulator
- VectorVest Variator
- VectorVest Watchdog