HOT TOPICS LIST
- MACD
- Fibonacci
- RSI
- Gann
- ADXR
- Stochastics
- Volume
- Triangles
- Futures
- Cycles
- Volatility
- ZIGZAG
- MESA
- Retracement
- Aroon
INDICATORS LIST
LIST OF TOPICS
PRINT THIS ARTICLE
by Matt Blackman
SNAP was hit hard in the wake of its celebrated IPO in 2017 but has shown an incredible recovery since then. Is the worst over for this new tech darling or is it simply experiencing a snap-back move?
Position: N/A
Matt Blackman
Matt Blackman is a full-time technical and financial writer and trader. He produces corporate and financial newsletters, and assists clients in getting published in the mainstream media. Matt has earned the Chartered Market Technician (CMT) designation. Follow Matt on Twitter at www.twitter.com/RatioTrade
PRINT THIS ARTICLE
BULL/BEAR MARKET
SNAP - Snapback Recovery Or New Market Leader?
07/18/19 05:03:28 PMby Matt Blackman
SNAP was hit hard in the wake of its celebrated IPO in 2017 but has shown an incredible recovery since then. Is the worst over for this new tech darling or is it simply experiencing a snap-back move?
Position: N/A
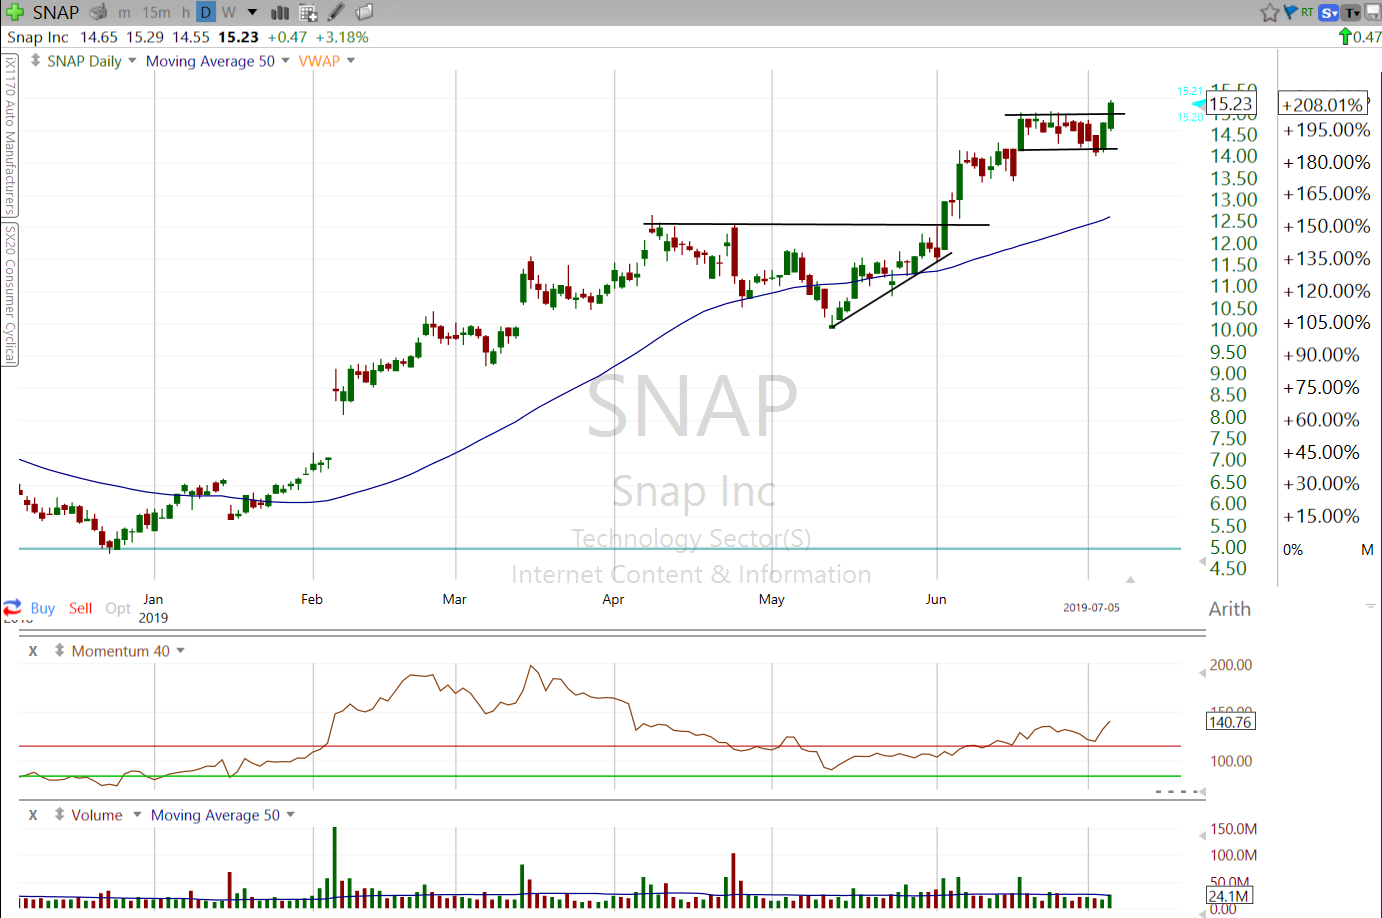
| Snap, Inc. is an American technology company, founded in September 2011. Its products include flagship Snapchat as well as Spectacles, Bitmoji, and Zenly. Dubbed the biggest initial public offering (IPO) since Alibaba went public in 2014, SNAP was priced at $17 per share March 2, 2017. On its second day of trading, the stock hit a high of $29.44 before beginning a long decline to drop below $5 in December 2018. But since then, it has demonstrated a remarkable recovery making it the best performing stock on my market leaders list in early July 2019. On July 5, it pierced above bull flag resistance, moving above $15 for the first time since April 2018. As we see from figure 1, SNAP has risen more than 200% since its December low. |

|
| Figure 1. Daily chart of SNAP showing its respectable recovery since its December 2018 low. |
| Graphic provided by: Freestockcharts.com. |
| |
| Fundamentally, the good news is that Snap, Inc. has enjoyed quarter over quarter earnings growth in the last four quarters with earnings rising more than 29% in the last year. The bad news is that it lost $1.2 billion in the last year. |

|
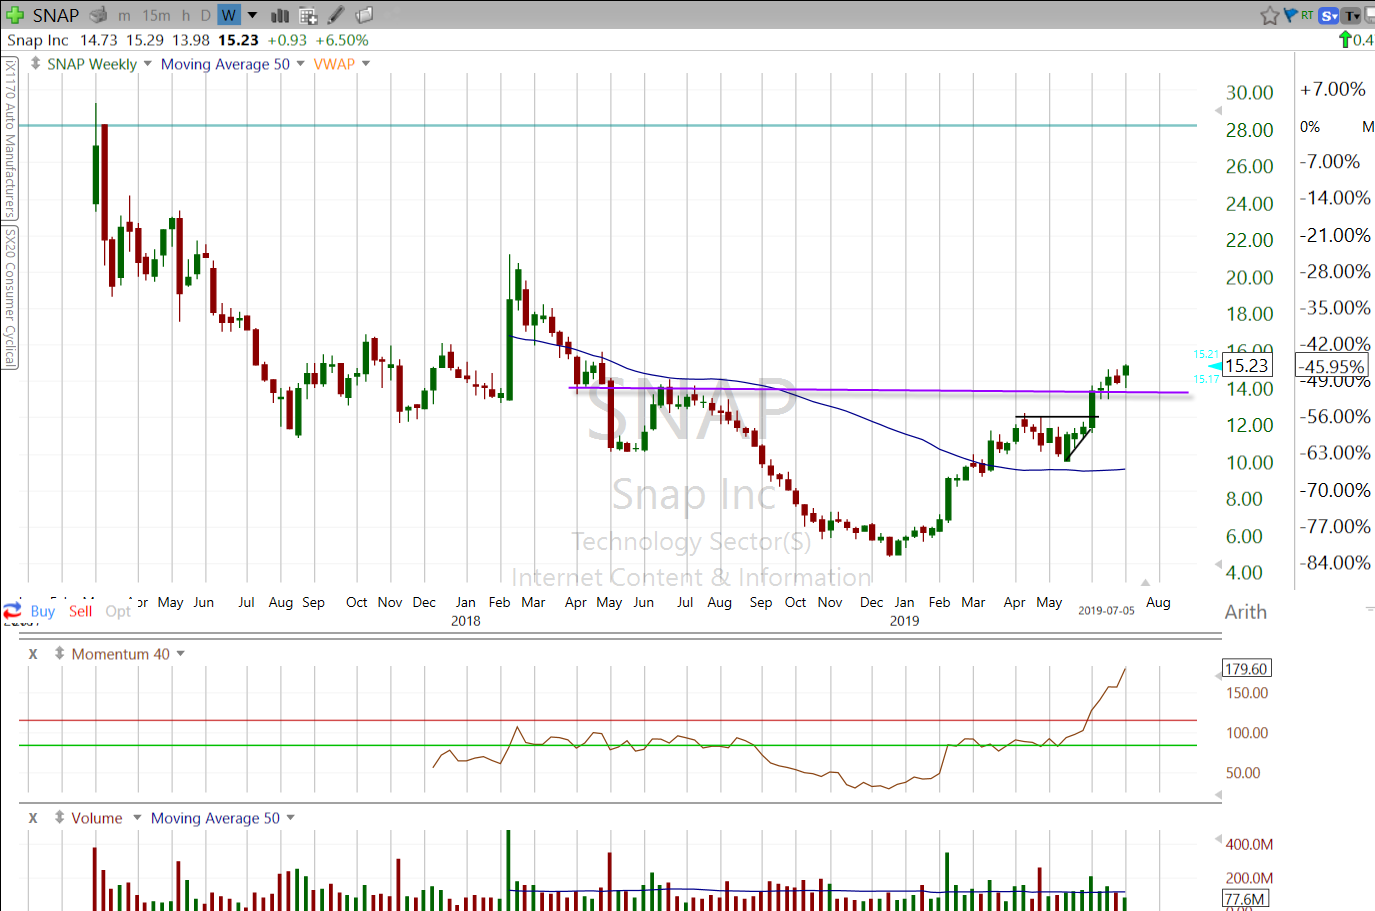
| Figure 2. Weekly chart of SNAP showing how it performed from its IPO. |
| Graphic provided by: Freestockcharts.com. |
| |
| SNAP's long-term chart is less impressive. As we see after hitting a high on the second day of trading, the stock dropped a gut-wrenching 84% before bottoming in late December 2018. So far at least, 2019 has been a much better year for the stock. The big question is whether it can continue to defy its early history to move above its all-time high of $29.44 while burning cash, or whether gravity and the market will start to take their toll. At this point, it looks like a short term technical play as long as it continues to post bullish patterns like the latest bull flag. Only time will tell if it will continue to outperform. |
Matt Blackman is a full-time technical and financial writer and trader. He produces corporate and financial newsletters, and assists clients in getting published in the mainstream media. Matt has earned the Chartered Market Technician (CMT) designation. Follow Matt on Twitter at www.twitter.com/RatioTrade
| Title: | Author |
| Company: | TradeSystemGuru |
| Address: | Box 2589 |
| Garibaldi Highlands, BC V0N1T0 | |
| Phone # for sales: | 6048989069 |
| E-mail address: | indextradermb@gmail.com |
Traders' Resource Links | |
| TradeSystemGuru has not added any product or service information to TRADERS' RESOURCE. | |
Click here for more information about our publications!
PRINT THIS ARTICLE

Request Information From Our Sponsors
- StockCharts.com, Inc.
- Candle Patterns
- Candlestick Charting Explained
- Intermarket Technical Analysis
- John Murphy on Chart Analysis
- John Murphy's Chart Pattern Recognition
- John Murphy's Market Message
- MurphyExplainsMarketAnalysis-Intermarket Analysis
- MurphyExplainsMarketAnalysis-Visual Analysis
- StockCharts.com
- Technical Analysis of the Financial Markets
- The Visual Investor
- VectorVest, Inc.
- Executive Premier Workshop
- One-Day Options Course
- OptionsPro
- Retirement Income Workshop
- Sure-Fire Trading Systems (VectorVest, Inc.)
- Trading as a Business Workshop
- VectorVest 7 EOD
- VectorVest 7 RealTime/IntraDay
- VectorVest AutoTester
- VectorVest Educational Services
- VectorVest OnLine
- VectorVest Options Analyzer
- VectorVest ProGraphics v6.0
- VectorVest ProTrader 7
- VectorVest RealTime Derby Tool
- VectorVest Simulator
- VectorVest Variator
- VectorVest Watchdog
