

HOT TOPICS LIST
- MACD
- Fibonacci
- RSI
- Gann
- ADXR
- Stochastics
- Volume
- Triangles
- Futures
- Cycles
- Volatility
- ZIGZAG
- MESA
- Retracement
- Aroon
INDICATORS LIST
LIST OF TOPICS
PRINT THIS ARTICLE
by Fawad Razaqzada
Thanks to falling yields and de-escalation in US-China trade dispute, the S&P 500 has hit fresh uncharted territories. But with corporate earnings outlook deteriorating, a correction could be on the way soon. For now, dip buyers are in control.
Position: N/A
Fawad Razaqzada
Fawad Razaqzada is an experienced analyst and economist having been involved in the financial markets since 2010 working for leading global FX and CFD brokerages. Having graduated with a degree in economics and leveraging years of financial market experience, Fawad provides retail and professional traders worldwide with succinct fundamental & technical analysis. In addition, he also offers premium trade signals to subscribers, and trading education to help shorten the learning curves of developing traders. He has also been trading on his personal account for many years. Follow Fawad on twitter @Trader_F_R or visit his website at TradingCandles.com.
PRINT THIS ARTICLE
TECHNICAL ANALYSIS
What's Next For The Markets?
07/11/19 04:47:06 PMby Fawad Razaqzada
Thanks to falling yields and de-escalation in US-China trade dispute, the S&P 500 has hit fresh uncharted territories. But with corporate earnings outlook deteriorating, a correction could be on the way soon. For now, dip buyers are in control.
Position: N/A
| The de-escalation in the US-China trade dispute has undoubtedly helped to push the markets into virgin territories again, but it is only part of the reason behind the rally. The invisible hand — so to speak — has been the falling bond yields. As global economic data softened, and investors worried about trade wars, central banks stepped up to prevent a crash by lowering interest rates and dropping their hawkish stances. As bond yields fell (and bond prices rallied), yield-seeking investors increasingly favored equities over other assets, as they provide comparatively higher returns for acceptable levels of risk. |
| However, while things look calm on the surface, the risks of a potential correction are growing as the outlook for corporate earnings growth continues to deteriorate with a slowing global economy. Indeed, there is only so much higher stocks can go from here as eventually the risks of an economic downturn will outweigh the benefits equities are receiving from falling yields and lower interest rates outlook. Paradoxically, if incoming data improves sharply, this would increase the odds for a potential correction as the requirement for rate cuts from the Fed and other central banks would fall. |
| So, whichever way you look at it, a correction looks likely in the coming months. However, the trend is clearly bullish right now, and so I will continue to favor looking for long rather than short setups for now until the charts tell us otherwise. |
|
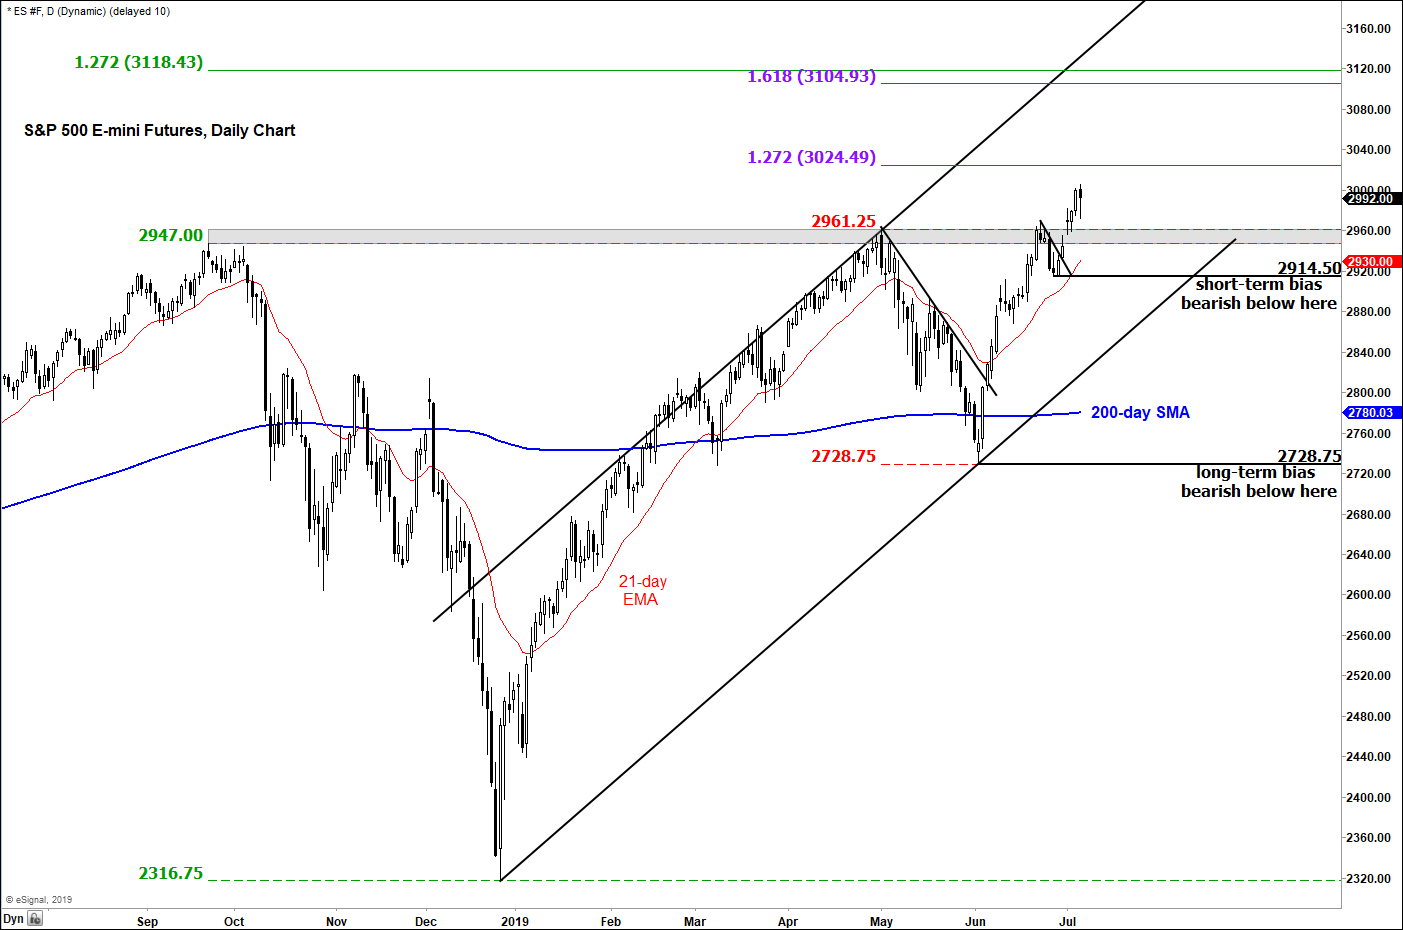
| Figure 1. S&P 500 E-mini Futures Daily Chart. |
| Graphic provided by: eSignal. |
| |
| To approach the markets tactically, I have plotted a couple of scenarios on the daily chart of the S&P 500 E-mini futures in Figure 1. With the index making higher highs and higher lows, fading the dips into support areas such as 2947-2961 should be preferred than selling into the rallies. Some of the bullish objectives include 3024/5 and the 3105-3119 range. Both of these areas converge with Fibonacci extension levels, with the latter also roughly marking the resistance trend of the bullish channel. As a minimum, we could see some profit-taking around these levels should we get there. |
| But if a recent low breaks, such as the 2914.50 level, and there is acceptance below it, then in that case, the short-term focus will turn bearish. Longer-term, the outlook would turn negative only if we break a more significant low such as 2728.75, for then the index will have also taken out the support trend of its bullish channel and the 200-day moving average. |
Fawad Razaqzada is an experienced analyst and economist having been involved in the financial markets since 2010 working for leading global FX and CFD brokerages. Having graduated with a degree in economics and leveraging years of financial market experience, Fawad provides retail and professional traders worldwide with succinct fundamental & technical analysis. In addition, he also offers premium trade signals to subscribers, and trading education to help shorten the learning curves of developing traders. He has also been trading on his personal account for many years. Follow Fawad on twitter @Trader_F_R or visit his website at TradingCandles.com.
| Title: | Financial Market Analyst |
| Company: | TradingCandles.com |
| London, | |
| Website: | tradingcandles.com |
| E-mail address: | fawad.razaqzada@hotmail.co.uk |
Traders' Resource Links | |
| TradingCandles.com has not added any product or service information to TRADERS' RESOURCE. | |
Click here for more information about our publications!
PRINT THIS ARTICLE

Request Information From Our Sponsors
- StockCharts.com, Inc.
- Candle Patterns
- Candlestick Charting Explained
- Intermarket Technical Analysis
- John Murphy on Chart Analysis
- John Murphy's Chart Pattern Recognition
- John Murphy's Market Message
- MurphyExplainsMarketAnalysis-Intermarket Analysis
- MurphyExplainsMarketAnalysis-Visual Analysis
- StockCharts.com
- Technical Analysis of the Financial Markets
- The Visual Investor
- VectorVest, Inc.
- Executive Premier Workshop
- One-Day Options Course
- OptionsPro
- Retirement Income Workshop
- Sure-Fire Trading Systems (VectorVest, Inc.)
- Trading as a Business Workshop
- VectorVest 7 EOD
- VectorVest 7 RealTime/IntraDay
- VectorVest AutoTester
- VectorVest Educational Services
- VectorVest OnLine
- VectorVest Options Analyzer
- VectorVest ProGraphics v6.0
- VectorVest ProTrader 7
- VectorVest RealTime Derby Tool
- VectorVest Simulator
- VectorVest Variator
- VectorVest Watchdog