

HOT TOPICS LIST
- MACD
- Fibonacci
- RSI
- Gann
- ADXR
- Stochastics
- Volume
- Triangles
- Futures
- Cycles
- Volatility
- ZIGZAG
- MESA
- Retracement
- Aroon
INDICATORS LIST
LIST OF TOPICS
PRINT THIS ARTICLE
by Fawad Razaqzada
More often than not, the refusal of price to do what the technicals suggests leads to significant moves in the opposite direction. So is Netflix's refusal to go down a sign of strength, and thus an early indication of an eventual bullish breakout?
Position: N/A
Fawad Razaqzada
Fawad Razaqzada is an experienced analyst and economist having been involved in the financial markets since 2010 working for leading global FX and CFD brokerages. Having graduated with a degree in economics and leveraging years of financial market experience, Fawad provides retail and professional traders worldwide with succinct fundamental & technical analysis. In addition, he also offers premium trade signals to subscribers, and trading education to help shorten the learning curves of developing traders. He has also been trading on his personal account for many years. Follow Fawad on twitter @Trader_F_R or visit his website at TradingCandles.com.
PRINT THIS ARTICLE
TECHNICAL ANALYSIS
Netflix Stuck Between A Rock And A Hard Place
06/28/19 04:12:44 PMby Fawad Razaqzada
More often than not, the refusal of price to do what the technicals suggests leads to significant moves in the opposite direction. So is Netflix's refusal to go down a sign of strength, and thus an early indication of an eventual bullish breakout?
Position: N/A
| Netflix has been displaying lots of bearish-looking price patterns on its charts. Yet the stock has so far refused to do what it "should". Instead of breaking down, NFLX has managed to hold its own rather well. Granted, it may well be too early to expect a bullish breakout as the stock is still stuck inside the consolidation range from early parts of 2019, and we may even see a sell-off, after all. But the bears have had plenty of time to drive the stock lower and so far haven't been able to do so. Thus, I am leaning more towards the bullish argument at this stage and will hold that view until, and unless, the chart proves me wrong. |
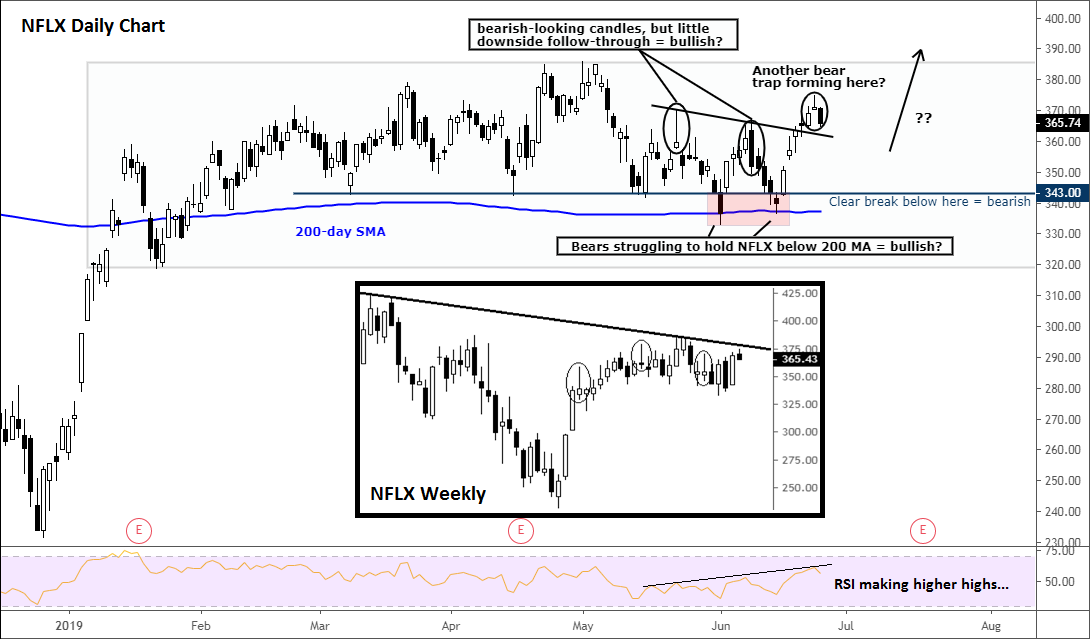
| As can be seen from main daily chart of Netflix in Figure 1, the stock has been basing above the 200-day moving average for several months, with $343 proving to be a pivotal level. This comes despite two distinct reversal patterns having been formed on the daily chart on May 22 and June 10: inverted hammer and bearish engulfing patterns, respectively. Yet at the start of this week, the stock broke higher to reach its best level since early May, thus taking out the highs of the above-mentioned candles. Surely, if those were bearish price patterns, the stock should have gone down instead of up. |
|
| Figure 1. Daily and weekly charts for NFLX. |
| Graphic provided by: TradingView. |
| |
| Indeed, similar patterns could be observed on the higher weekly timeframe (inset). On this time frame, we can see at least three inverted hammer candles, yet the stock has drifted higher rather than lower. Is it therefore gearing up for a potential breakout, despite trading lower at the time of this writing? |
| Focusing again on the daily chart, and specifically on price action around this week's trading, we can see that Netflix is creating a potential evening star formation. This three-candle reversal pattern usually precedes sizeable corrections. It is definitely a warning sign for the bulls. However, I am not buying it; I would only turn bearish on Netflix if it goes on to break that $343 support decisively. Indeed, I am half-expecting this evening star reversal pattern to end up being another false bearish signal and thus a trap for the bears. What I would like to see now is a new high above this week's range. If seen, that could be the trigger for the breakout I am looking for. |
Fawad Razaqzada is an experienced analyst and economist having been involved in the financial markets since 2010 working for leading global FX and CFD brokerages. Having graduated with a degree in economics and leveraging years of financial market experience, Fawad provides retail and professional traders worldwide with succinct fundamental & technical analysis. In addition, he also offers premium trade signals to subscribers, and trading education to help shorten the learning curves of developing traders. He has also been trading on his personal account for many years. Follow Fawad on twitter @Trader_F_R or visit his website at TradingCandles.com.
| Title: | Financial Market Analyst |
| Company: | TradingCandles.com |
| London, | |
| Website: | tradingcandles.com |
| E-mail address: | fawad.razaqzada@hotmail.co.uk |
Traders' Resource Links | |
| TradingCandles.com has not added any product or service information to TRADERS' RESOURCE. | |
Click here for more information about our publications!
Comments

Request Information From Our Sponsors
- StockCharts.com, Inc.
- Candle Patterns
- Candlestick Charting Explained
- Intermarket Technical Analysis
- John Murphy on Chart Analysis
- John Murphy's Chart Pattern Recognition
- John Murphy's Market Message
- MurphyExplainsMarketAnalysis-Intermarket Analysis
- MurphyExplainsMarketAnalysis-Visual Analysis
- StockCharts.com
- Technical Analysis of the Financial Markets
- The Visual Investor
- VectorVest, Inc.
- Executive Premier Workshop
- One-Day Options Course
- OptionsPro
- Retirement Income Workshop
- Sure-Fire Trading Systems (VectorVest, Inc.)
- Trading as a Business Workshop
- VectorVest 7 EOD
- VectorVest 7 RealTime/IntraDay
- VectorVest AutoTester
- VectorVest Educational Services
- VectorVest OnLine
- VectorVest Options Analyzer
- VectorVest ProGraphics v6.0
- VectorVest ProTrader 7
- VectorVest RealTime Derby Tool
- VectorVest Simulator
- VectorVest Variator
- VectorVest Watchdog