HOT TOPICS LIST
- MACD
- Fibonacci
- RSI
- Gann
- ADXR
- Stochastics
- Volume
- Triangles
- Futures
- Cycles
- Volatility
- ZIGZAG
- MESA
- Retracement
- Aroon
INDICATORS LIST
LIST OF TOPICS
PRINT THIS ARTICLE
by Koos van der Merwe
Forecasting the date for a cycle low is relatively easy as I have shown in my two previous articles, "Cycles and the S&P 500 Index" (12/13/02), and "Nasdaq and Cycles" (12/16/02), but forecasting a cycle high can be difficult. Here are two techniques that I use.
Position: N/A
Koos van der Merwe
Has been a technical analyst since 1969, and has worked as a futures and options trader with First Financial Futures in Johannesburg, South Africa.
PRINT THIS ARTICLE
CYCLES
Forecasting the HIGH of a Cycle
12/31/02 09:45:46 AMby Koos van der Merwe
Forecasting the date for a cycle low is relatively easy as I have shown in my two previous articles, "Cycles and the S&P 500 Index" (12/13/02), and "Nasdaq and Cycles" (12/16/02), but forecasting a cycle high can be difficult. Here are two techniques that I use.
Position: N/A
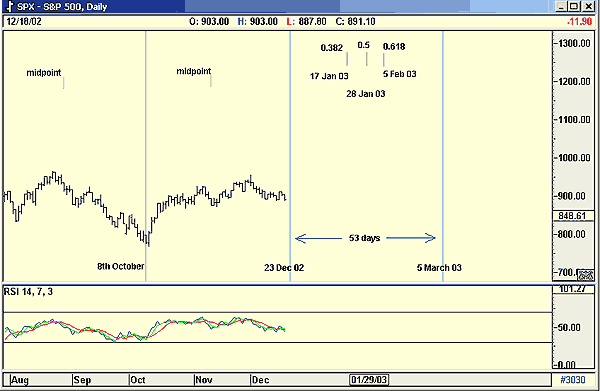
 Figure 1: Estimating the date of a cycle high. Fibonacci Ratios Figure 1 is a close-up of the S&P 500 chart I used in my article "Cycles and the S&P 500 Index." In the article I identified a 53-day cycle, the latest of which began on December 23, 2002, and ends on the 5th of March, 2003. From this cycle, I have calculated the three main Fibonacci ratios: 53 days x 38.2% = 20.24 = 20 trading days 53 days x 50% = 26.5 = 27 trading days 53 days x 61.8% = 32.75 = 33 trading days Looking at a calendar and adding these days to the December 23 will give you the date of the expected high. Do not count weekends, but do count public holidays. Most computer programs have a Fibonacci time indicator available for quick calculations. Also, do allow two days ether side for error and do not forget that in a bear market, the high will lean to the 38.2% mark, a neutral market will be at 50%, and a bull market will lean to the 61.8% mark. |
| Will the chart actually meet these dates as predicted? No, not necessarily. These are meant to be used as guides only. My second technique, Gann analysis, allows for a more accurate forecast. |

|
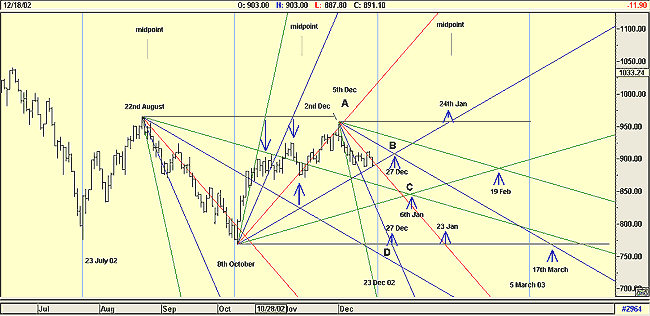
| Figure 2: Forecasting market turning points using a Gann fan. |
| Graphic provided by: AdvancedGET. |
| |
| Gann Fan The fan technique was developed by WD Gann. A Gann fan is created by drawing horizontal lines from prominent highs and lows. From these initial lines, a 45 degree angle line, called a 1 x 1 line is drawn, then a second line at 63 degrees called a 1 x 2, and a third line at 75 degrees called a 1 x 4 are added. From the low, the angles are calculated upwards, and for a high, the angle lines are calculated downwards. Each line on my chart has a different color, which is important. The 1x1 (45 degree angle) is red; the 2 x 1 and 1 x 2 are blue, and the 4 x 1 and 1 x 4 are green. Where the fan lines intersect are thought to be market turning points. |
| Being a traditionalist, I prefer to calculate the angle using Gann numbers 1, 2, 5 and multiples and divisions by 10 of these numbers. Today's computer programs allow Gann fans to be drawn from fractions of any number. Figure 2 shows my Gann fan lines from the August 22nd high, the October 8th low, and the December 2nd high. |
| I have found that an accurate way to use a Gann fan to determine a market turning point is to place the fan on the most recent turning point, and draw a horizontal line from that point. Where the fan crosses that horizontal line drawn from the PREVIOUS pivot point, suggests a possible turning point. For example December 27th, point D on the chart, could be the cycle low, and not December 23rd as the 53-day cycle has determined. The downward 1 x 1 angle from December 2nd (A), crosses the horizontal line drawn from the low of the 8th October, on January 23rd. Is this a possible date for the high? Or could it be January 24th as suggested by the 1 x 2 line (blue) crossing the horizontal line drawn from the pivot point at 'A'? Finally I will take notice of the date that two of the same coloured lines cross, highlighted by the points 'B' and 'C' on the chart. These points can be major or intermediate highs or low turning points. In conclusion, do note that where the simple cycle analysis calls for a major low on March 5, 2003, the Gann fan is calling for a turning point (high or low) on the 17th March. Do I use Gann fans in my analysis? Yes, I do, but more for trading than investing. They can be very complicated but once you understand the technique they can also be very rewarding. |
Has been a technical analyst since 1969, and has worked as a futures and options trader with First Financial Futures in Johannesburg, South Africa.
| Address: | 3256 West 24th Ave |
| Vancouver, BC | |
| Phone # for sales: | 6042634214 |
| E-mail address: | petroosp@gmail.com |
Click here for more information about our publications!
Comments
Date: 12/31/02Rank: 4Comment:
Date: 12/31/02Rank: 3Comment:
Date: 01/01/03Rank: 5Comment:
Date: 01/02/03Rank: 5Comment: att m singer
could i have more details about
your newletters
thank
YvonM@netcourrier.com
Date: 01/07/03Rank: 4Comment:
Date: 01/07/03Rank: 4Comment:

Request Information From Our Sponsors
- StockCharts.com, Inc.
- Candle Patterns
- Candlestick Charting Explained
- Intermarket Technical Analysis
- John Murphy on Chart Analysis
- John Murphy's Chart Pattern Recognition
- John Murphy's Market Message
- MurphyExplainsMarketAnalysis-Intermarket Analysis
- MurphyExplainsMarketAnalysis-Visual Analysis
- StockCharts.com
- Technical Analysis of the Financial Markets
- The Visual Investor
- VectorVest, Inc.
- Executive Premier Workshop
- One-Day Options Course
- OptionsPro
- Retirement Income Workshop
- Sure-Fire Trading Systems (VectorVest, Inc.)
- Trading as a Business Workshop
- VectorVest 7 EOD
- VectorVest 7 RealTime/IntraDay
- VectorVest AutoTester
- VectorVest Educational Services
- VectorVest OnLine
- VectorVest Options Analyzer
- VectorVest ProGraphics v6.0
- VectorVest ProTrader 7
- VectorVest RealTime Derby Tool
- VectorVest Simulator
- VectorVest Variator
- VectorVest Watchdog
