

HOT TOPICS LIST
- MACD
- Fibonacci
- RSI
- Gann
- ADXR
- Stochastics
- Volume
- Triangles
- Futures
- Cycles
- Volatility
- ZIGZAG
- MESA
- Retracement
- Aroon
INDICATORS LIST
LIST OF TOPICS
PRINT THIS ARTICLE
by Mark Rivest
See where this important industrial metal could make a bottom.
Position: Buy
Mark Rivest
Independent investment advisor, trader and writer. He has written articles for Technical Analysis of Stocks & Commodities, Traders.com Advantage,Futuresmag.com and, Finance Magnates. Author of website Four Dimension Trading.
PRINT THIS ARTICLE
TRIANGLES
Copper - Approaching Major Support
06/13/19 02:39:52 PMby Mark Rivest
See where this important industrial metal could make a bottom.
Position: Buy
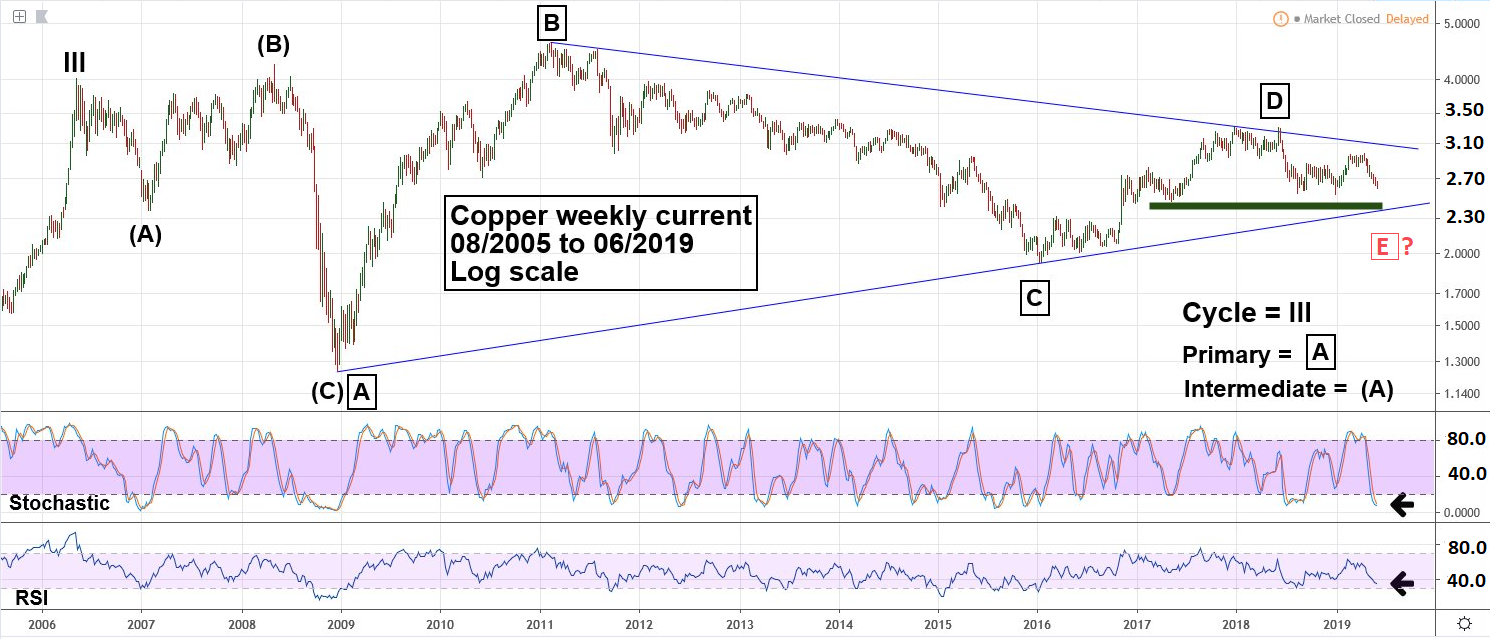
| The near-term Copper decline that began in April 2019 could be the final phase of an Elliott wave pattern that started in 2006. This pattern, along with long-term momentum and sentiment indicators provide evidence that a great opportunity to buy Copper could be only days away. Long-Term View It's possible that Copper futures have been forming an Elliott wave Horizontal Triangle since 2006. Horizonal Triangles are corrective patterns to the primary trend composed of five sub waves in which each subdivide into three waves or a combination of three wave structures. Please see the weekly continuous current contract Copper futures chart illustrated in Figure 1. Most of the time the sub waves of a Horizontal Triangle will be either Single or Double Zigzags, the first sub wave labeled "A boxed" is a less common Expanding Flat. The subsequent Primary wave "B" appears to be a Single Zigzag followed by a Double Zigzag Primary wave "C". The supposed Primary wave "D" counts best as a Single Zigzag. This variation among the sub waves follows the Elliott wave guidelines for alternation. The most intriguing aspect of the chart is that price is now approaching the long-term rising trend line connecting the late 2008 bottom with the early 2016 bottom. The trend line is also near an area of chart support. Also note that the weekly Stochastic has already reached the oversold zone and weekly RSI is close to its oversold zone. |
|
| Figure 1. The most intriguing aspect of the chart is that price is now approaching the long-term rising trend line connecting the late 2008 bottom with the early 2016 bottom. |
| Graphic provided by: tradingview.com. |
| |
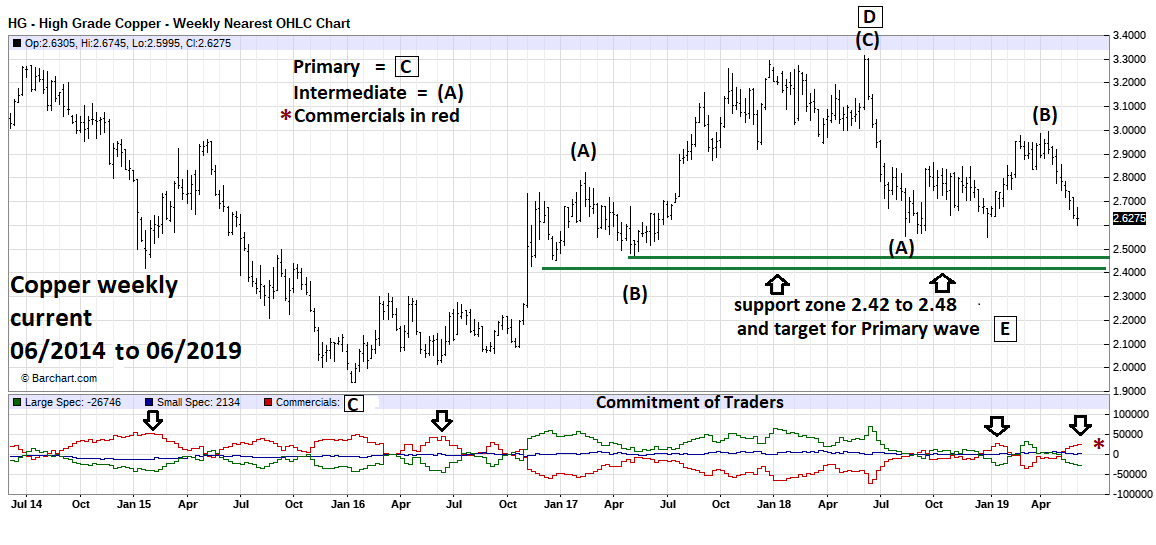
| Intermediate View Please see the weekly continuous current contract Copper futures chart 2014 to 2019 illustrated in Figure 2. The Commitment of Traders report is issued weekly showing the net commitment of Small Speculators, Large Speculators and Commercials for various Futures markets. The Commercials are the group to focus on because they have the most contracts, and presumably the most knowledge, about the Futures they trade. Note that since the recent decline began in April, Commercials have been increasing their long positions and are now net long. This is in line with what the Commercials have done at most of the significant bottoms during the last five years. If Copper prices continue to decline while Commercials increase their net long position, probabilities of a bottom will also increase. The price zone derived from chart support is 2.42 to 2.48. Additionally, a .618 Fibonacci retrace of the rally from the January 2016 bottom to the June 2018 peak is at 2.46 near the center of the support zone. |
|
| Figure 2. Note that since the recent decline began in April, Commercials have been increasing their long positions and are now net long. |
| Graphic provided by: Barcharts.com. |
| |
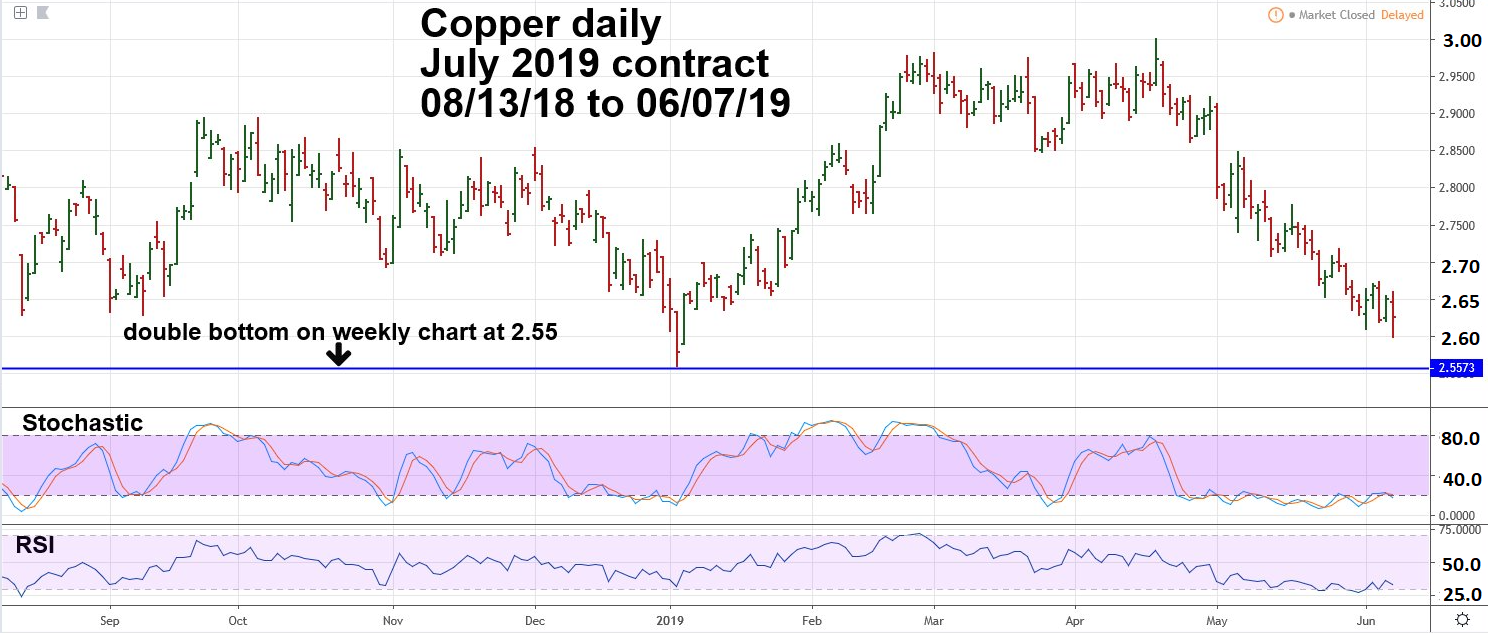
| Short-Term View Please see the daily July 2019 Copper futures chart illustrated in Figure 3. Another price area to focus on is 2.55 to 2.56. This is the double bottom on the weekly chart connecting the lows of August 2018 and early January 2019. A bottom could have been made on June 7 because the daily Stochastic has been in the oversold area for several weeks. On June 7 both the daily Stochastic and RSI had minor bullish divergences. Normally a breach of a double bottom is very bearish. However, in the case of Copper 2.55 to 2.56 there's chart and long-term trend line support just below 2.55. If price breaks 2.55 there may only be a brief one- or two-day mini panic before bottoming in the 2.42 to 2.48 zone. |
|
| Figure 3. If price breaks 2.55 there may only be a brief one- or two-day mini panic before bottoming in the 2.42 to 2.48 zone. |
| Graphic provided by: tradingview.com. |
| |
| Conclusion If an Elliott wave Horizontal Triangle is nearing completion the most likely subsequent action is referred to as a post triangle thrust — a powerful move in the direction of the primary trend, in this case up. The thrust can be measured by the widest part of the Horizontal Triangle, which is the difference between the high made in 2011 at 4.64 and the bottom in 2008 at 1.25. The difference is 3.39 and would be added to the termination point of wave "E". If this scenario is in play it implies a move lasting years and going far above the high of 4.64. A less bullish scenario could happen if the triangle is still under construction or some other pattern is in play. In this situation, if a near term bottom develops the subsequent rally could only last for several weeks and likely fall short of a new all-time high. A break below 2.40 could open the door for a decline down to 2.00. In the very short-term, focus on the Commitment of Traders report and momentum oscillators. If an important Copper bottom is not already in place, there could be a great buying opportunity developing before the end of June 2019. Further Reading: Frost A.J and Robert Prechter (1985) "Elliott Wave Principle", New Classics Library. |
Independent investment advisor, trader and writer. He has written articles for Technical Analysis of Stocks & Commodities, Traders.com Advantage,Futuresmag.com and, Finance Magnates. Author of website Four Dimension Trading.
| Website: | www.fourdimensiontrading.com |
| E-mail address: | markrivest@gmail.com |
Click here for more information about our publications!
PRINT THIS ARTICLE

Request Information From Our Sponsors
- StockCharts.com, Inc.
- Candle Patterns
- Candlestick Charting Explained
- Intermarket Technical Analysis
- John Murphy on Chart Analysis
- John Murphy's Chart Pattern Recognition
- John Murphy's Market Message
- MurphyExplainsMarketAnalysis-Intermarket Analysis
- MurphyExplainsMarketAnalysis-Visual Analysis
- StockCharts.com
- Technical Analysis of the Financial Markets
- The Visual Investor
- VectorVest, Inc.
- Executive Premier Workshop
- One-Day Options Course
- OptionsPro
- Retirement Income Workshop
- Sure-Fire Trading Systems (VectorVest, Inc.)
- Trading as a Business Workshop
- VectorVest 7 EOD
- VectorVest 7 RealTime/IntraDay
- VectorVest AutoTester
- VectorVest Educational Services
- VectorVest OnLine
- VectorVest Options Analyzer
- VectorVest ProGraphics v6.0
- VectorVest ProTrader 7
- VectorVest RealTime Derby Tool
- VectorVest Simulator
- VectorVest Variator
- VectorVest Watchdog