

HOT TOPICS LIST
- MACD
- Fibonacci
- RSI
- Gann
- ADXR
- Stochastics
- Volume
- Triangles
- Futures
- Cycles
- Volatility
- ZIGZAG
- MESA
- Retracement
- Aroon
INDICATORS LIST
LIST OF TOPICS
PRINT THIS ARTICLE
by Fawad Razaqzada
Monday saw shares in Amazon, Apple, Facebook and Google drop sharply on the back of reports regulators in the US were preparing to investigate whether these tech giants have misused their market power to harm competition.
Position: N/A
Fawad Razaqzada
Fawad Razaqzada is an experienced analyst and economist having been involved in the financial markets since 2010 working for leading global FX and CFD brokerages. Having graduated with a degree in economics and leveraging years of financial market experience, Fawad provides retail and professional traders worldwide with succinct fundamental & technical analysis. In addition, he also offers premium trade signals to subscribers, and trading education to help shorten the learning curves of developing traders. He has also been trading on his personal account for many years. Follow Fawad on twitter @Trader_F_R or visit his website at TradingCandles.com.
PRINT THIS ARTICLE
CHART ANALYSIS
Facebook Holding 200 MA For Now
06/06/19 03:56:52 PMby Fawad Razaqzada
Monday saw shares in Amazon, Apple, Facebook and Google drop sharply on the back of reports regulators in the US were preparing to investigate whether these tech giants have misused their market power to harm competition.
Position: N/A
| The probe could take several months or even years, should the regulators decide to open formal antitrust investigations. Even so, it is unlikely that the government will go for "nuclear options," which include forcing them to break up. So, I wouldn't be surprised if these stocks manage to regain some lost ground, at least in the short-term as investors wait for further details. |
| Among these companies, Facebook will be an interesting one to watch given its huge influence in the social media space as it also owns Instagram and WhatsApp. It has been criticised for allowing misleading posts and "fake news" to be posted and shared on its services. |
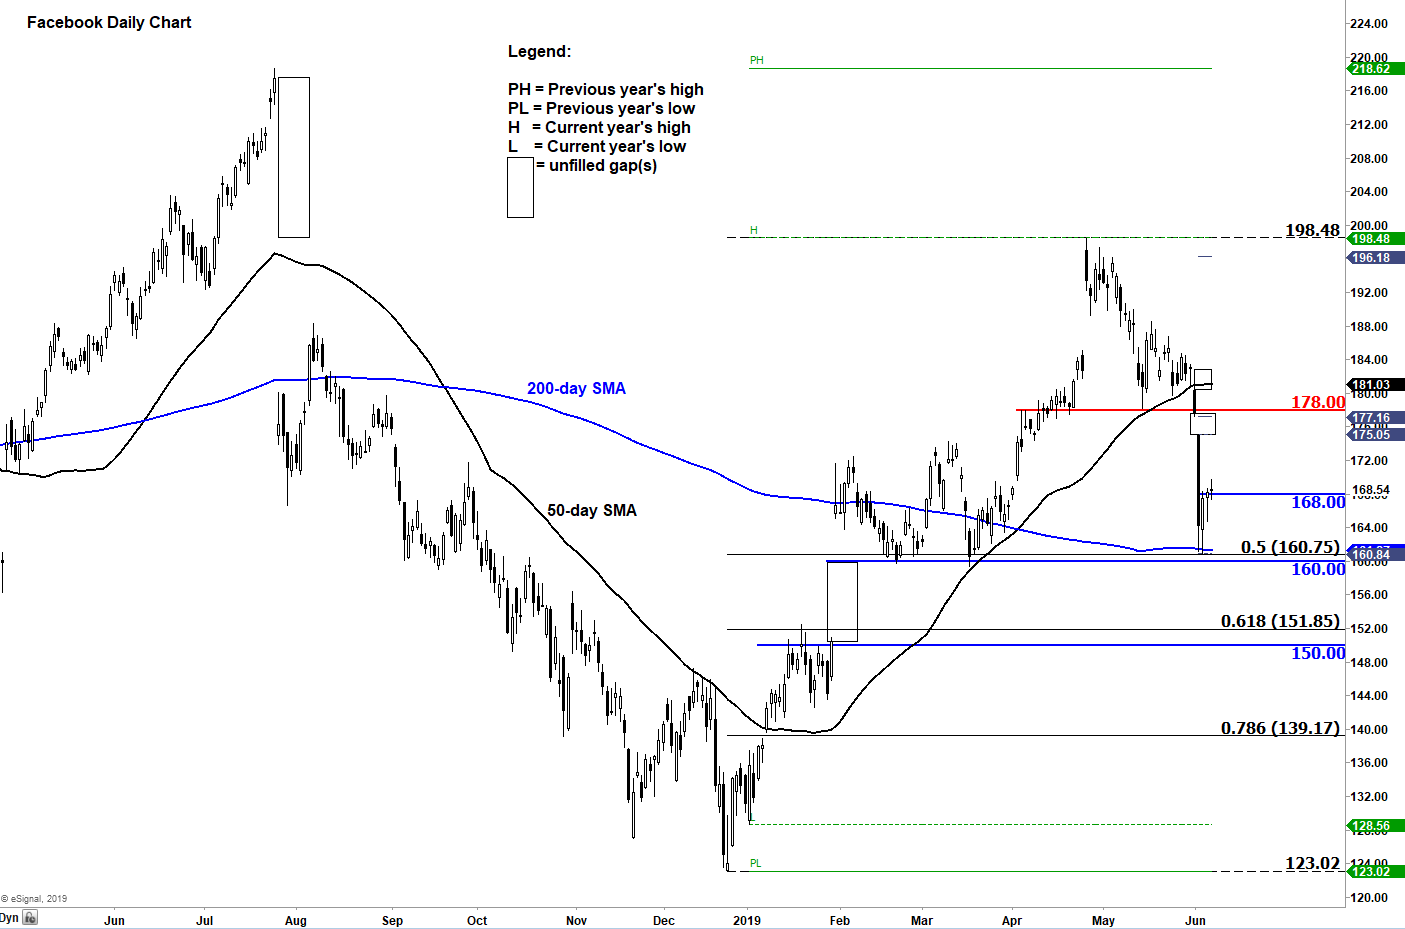
| Since Monday's drop, Facebook shares have managed to stage a minor rebound, finding support, for now, from the 200-day moving average at just above $161.00. The key question now is whether it will be able to regain those losses or fall further. |
|
| Figure 1. Daily chart for FB. |
| Graphic provided by: eSignal. |
| |
| From a purely technical point of view, I suppose a lot depends on price action around $168.00, where FB has traded around for the past few days. If it manages to find a base here then it may well go on to regain at least some of its losses, and potentially head back towards the next level of resistance at $178.00. However, a close back below $168.00 could see the social media giant go for a re-test of the recent lows and support around $160.00. |
| It is worth pointing out, though, that there is a huge ~$10 unfilled gap below $160.00 that could be "filled" should the weakness continue. If so, that would take FB to around $150.00, where it will meet the 61.8% Fibonacci retracement level against last year's low ($123.00). |
Fawad Razaqzada is an experienced analyst and economist having been involved in the financial markets since 2010 working for leading global FX and CFD brokerages. Having graduated with a degree in economics and leveraging years of financial market experience, Fawad provides retail and professional traders worldwide with succinct fundamental & technical analysis. In addition, he also offers premium trade signals to subscribers, and trading education to help shorten the learning curves of developing traders. He has also been trading on his personal account for many years. Follow Fawad on twitter @Trader_F_R or visit his website at TradingCandles.com.
| Title: | Financial Market Analyst |
| Company: | TradingCandles.com |
| London, | |
| Website: | tradingcandles.com |
| E-mail address: | fawad.razaqzada@hotmail.co.uk |
Traders' Resource Links | |
| TradingCandles.com has not added any product or service information to TRADERS' RESOURCE. | |
Click here for more information about our publications!
PRINT THIS ARTICLE

Request Information From Our Sponsors
- StockCharts.com, Inc.
- Candle Patterns
- Candlestick Charting Explained
- Intermarket Technical Analysis
- John Murphy on Chart Analysis
- John Murphy's Chart Pattern Recognition
- John Murphy's Market Message
- MurphyExplainsMarketAnalysis-Intermarket Analysis
- MurphyExplainsMarketAnalysis-Visual Analysis
- StockCharts.com
- Technical Analysis of the Financial Markets
- The Visual Investor
- VectorVest, Inc.
- Executive Premier Workshop
- One-Day Options Course
- OptionsPro
- Retirement Income Workshop
- Sure-Fire Trading Systems (VectorVest, Inc.)
- Trading as a Business Workshop
- VectorVest 7 EOD
- VectorVest 7 RealTime/IntraDay
- VectorVest AutoTester
- VectorVest Educational Services
- VectorVest OnLine
- VectorVest Options Analyzer
- VectorVest ProGraphics v6.0
- VectorVest ProTrader 7
- VectorVest RealTime Derby Tool
- VectorVest Simulator
- VectorVest Variator
- VectorVest Watchdog